Practice
Resources
Contests
Online IDE
New
Free Mock
Events New Scaler
Practice
Improve your coding skills with our resources
Contests
Compete in popular contests with top coders
logo
Events
Attend free live masterclass hosted by top tech professionals
New
Scaler
Explore Offerings by SCALER

Descriptive Statistics

Last Updated: Jan 10, 2022
Go to Problems
Contents

Measures of Variability

Measures of variability define how spread out the data is, basically how far the data points lie from the center of the distribution of the data. These measures usually comprise: 


Variance: Measures the degree of spread within the distribution. Mathematically speaking, variance is the average of squared distances from the mean. 
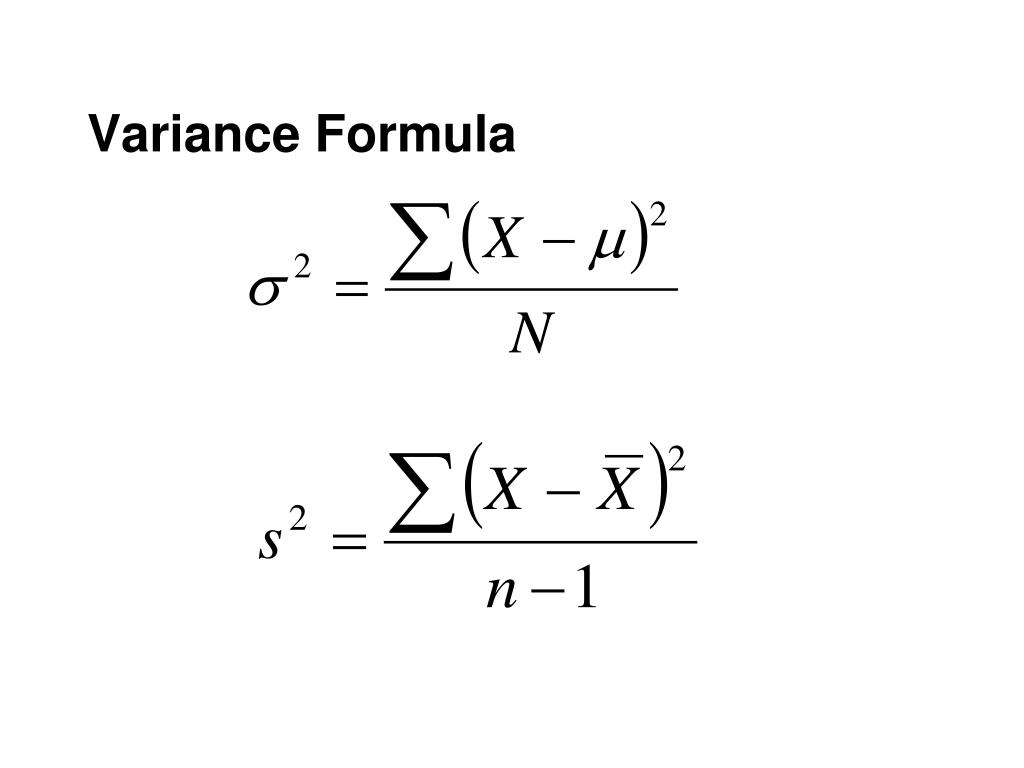
PPT - Variance Formula PowerPoint Presentation, free download - ID:7084253

Where:

s^2 represents the sample variance and 𝛔^2 represents the variance of the population.

Standard Deviation: This measures the dispersion of the data with respect to the mean, basically the average distance from the mean. Mathematically this is calculated as the square root of variance. 

                                  \sigma={\sqrt {\frac {\sum(x_{i}-{\mu})^{2}}{N}}}

Mean deviation: Similar to standard deviation, it measures the average deviation from the mean of the dataset. The only difference lies in the mathematical formulation of both. Mean deviation is calculated by taking the absolute difference between the data point and the mean, while standard deviation works on just the difference. Usually, the standard deviation is more preferred 

                                          \frac {1}{n} \sum \limits_{i=1}^n |x_i-m(X)|


Range: Basically, the difference between the highest and lowest number in a data. 

                 \text{Range}(X) = \mathrm{Max}(X) - \mathrm{Min}(X)

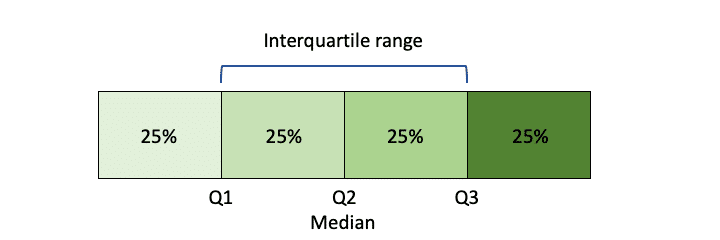
Interquartile range: This measures the difference between the 75th and 25th percentile range of the data. Percentile here basically indicates the value below which a certain percentage of the observations in a group of data samples fall.

Interquartile Range | Understand, Calculate & Visualize IQR

Video Courses
By

View All Courses
Excel at your interview with Masterclasses Know More
Certificate included
What will you Learn?
Free Mock Assessment
Fill up the details for personalised experience.
Phone Number *
OTP will be sent to this number for verification
+1 *
+1
Change Number
Graduation Year *
Graduation Year *
1994
1995
1996
1997
1998
1999
2000
2001
2002
2003
2004
2005
2006
2007
2008
2009
2010
2011
2012
2013
2014
2015
2016
2017
2018
2019
2020
2021
2022
2023
2024
2025
2026
2027
2028
2029
*Enter the expected year of graduation if you're student
Current Employer
Company Name
College you graduated from
College/University Name
Job Title
Job Title
Engineering Leadership
Software Development Engineer (Backend)
Software Development Engineer (Frontend)
Software Development Engineer (Full Stack)
Data Scientist
Android Engineer
iOS Engineer
Devops Engineer
Support Engineer
Research Engineer
Engineering Intern
QA Engineer
Co-founder
SDET
Product Manager
Product Designer
Backend Architect
Program Manager
Release Engineer
Security Leadership
Database Administrator
Data Analyst
Data Engineer
Non Coder
Other
Please verify your phone number
Edit
Resend OTP
By clicking on Start Test, I agree to be contacted by Scaler in the future.
Already have an account? Log in
Free Mock Assessment
Instructions from Interviewbit
Start Test