ICE Framework: How Growth Teams Prioritise Experiments (with Scoring Template)

Key Insights
- The ICE framework prioritises growth experiments using three factors: Impact, Confidence and Ease.
- Each factor can be scored on a 1–10 scale, with the scoring method defined by the team and applied consistently across experiments.
- For this guide, the ICE Score = (Impact + Confidence + Ease) ÷ 3, producing an average score from 1 to 10. Other teams use multiplication, so the formula should always be stated rather than assumed.
- A strong ICE score should be supported by analytics, previous experiments, customer research and implementation estimates, rather than intuition alone.
- ICE is designed as a prioritisation aid, not a prediction of experiment success. A high score does not guarantee a winning test.
- Teams can make ICE more consistent by recording evidence, discussing large scoring differences and revisiting scores when new information becomes available.
Growth teams rarely run out of ideas. They run out of time, people and testing capacity. The ICE framework gives teams a simple way to compare experiment ideas using three factors: Impact, Confidence and Ease. It helps answer one practical question: which experiment should we test first?
The framework is associated with growth marketer Sean Ellis and is designed to make experiment prioritisation faster and more consistent. It does not predict whether an experiment will win. Instead, it gives teams a common method for deciding where to focus limited resources.
This guide explains the ICE scoring method, a 1–10 rubric, a worked example, alternative frameworks, common scoring problems and a reusable ICE template.
What does ICE Stand For?
ICE stands for Impact, Confidence and Ease.
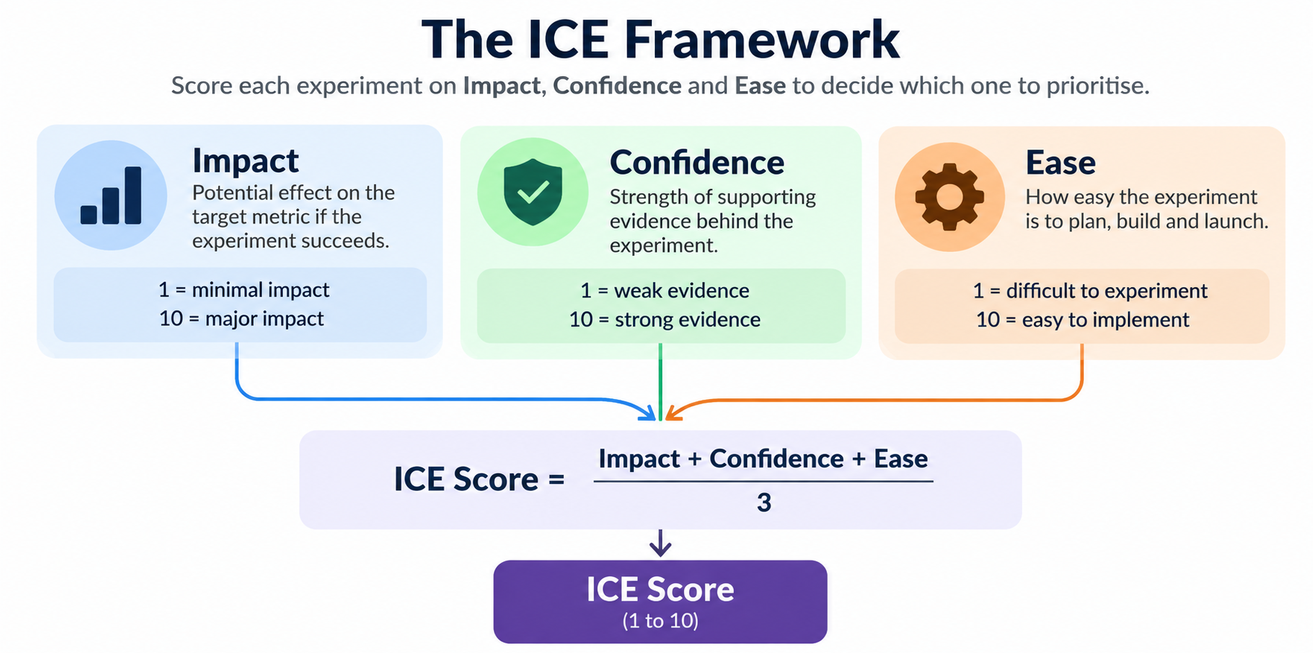
| Factor | What it measures | 1–10 guidance |
| Impact | Potential effect on the target metric | 1 = minimal, 10 = major |
| Confidence | Strength of evidence supporting the idea | 1 = weak, 10 = strong |
| Ease | How easy the experiment is to implement | 1 = difficult, 10 = easy |
The exact ICE formula is not universal. Some versions average the three scores, while others multiply them.
This article uses the average method:
ICE Score = (Impact + Confidence + Ease) ÷ 3
Using one formula consistently matters more than treating one convention as the only correct version.
Who Created the ICE Framework?
The ICE framework is associated with growth marketer Sean Ellis, who popularised structured experiment prioritisation within growth teams. Ellis is also associated with the term “growth hacking” and later documented growth experimentation practices in Hacking Growth.
The framework’s appeal is its simplicity: teams can score a large experiment backlog without building a complex prioritisation model.
How to Score Impact, Confidence and Ease?
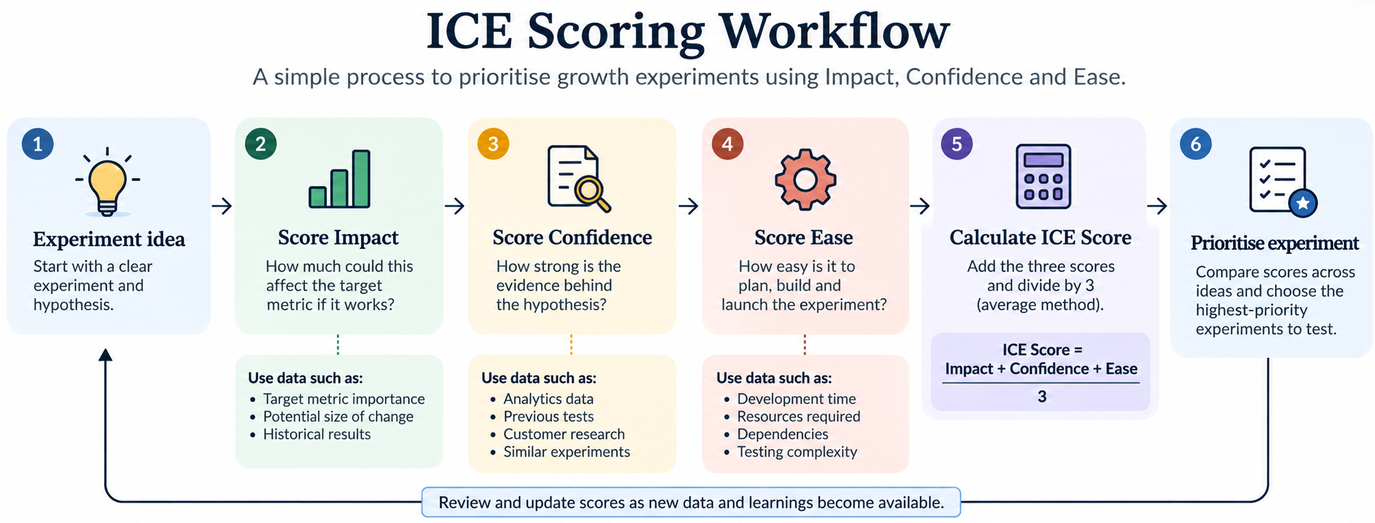
Score each ICE factor from 1 to 10 using defined criteria and evidence wherever possible.
How to Score Impact?
Impact measures the potential effect an experiment could have on the target metric if the experiment works.
A low-impact experiment might produce a small improvement to a secondary metric. A high-impact experiment could materially affect a core metric such as conversion, activation, retention or revenue.
Consider:
- How important is the target metric?
- How large could the change be?
- How many parts of the customer journey could it affect?
- What does historical data suggest?
Avoid giving an experiment a 10 simply because the idea sounds exciting.
How to Score Confidence?
Confidence measures how strong the evidence is behind the experiment hypothesis.
High-confidence scores can be supported by:
- Previous experiment results
- Analytics data
- Customer research
- User interviews
- Conversion funnel data
- Historical performance
- Similar tests or documented evidence
For example, a checkout experiment supported by repeated analytics showing users abandoning at the payment step has stronger evidence than an idea based only on a team’s intuition.
Confidence is particularly important because it prevents high-impact but poorly supported ideas from automatically dominating the backlog.
How to Score Ease?
Ease measures how easy the experiment is to plan, build and launch.
Remember: higher Ease means less effort.
An experiment that needs one copy change might receive an Ease score of 9 or 10. A test requiring engineering work, design changes, analytics setup and cross-team coordination might receive a much lower score.
Consider:
- Development time
- Design requirements
- Analytics setup
- Dependencies
- Number of teams involved
- Testing complexity
This distinction matters because Ease is not the same as Effort. Ease increases as implementation becomes simpler.
ICE Scoring Example: Prioritising 5 Marketing Experiments
An ICE scoring example shows how a growth team can compare very different experiments using the same rubric.
Suppose a team has five ideas and uses the average formula selected above.
| Experiment | Impact | Confidence | Ease | ICE Score | Reason for priority |
| Pricing-page CTA test | 8 | 8 | 8 | 8.0 | Strong evidence and easy to launch |
| Onboarding progress indicator | 8 | 8 | 7 | 7.7 | Reasonable evidence with manageable implementation |
| NPS survey | 4 | 8 | 9 | 7.0 | Easy to launch, but lower direct impact |
| Referral programme | 9 | 5 | 4 | 6.0 | High potential but greater uncertainty and effort |
| Checkout redesign | 8 | 7 | 1 | 5.3 | Potentially valuable but resource-intensive |
For the pricing-page CTA test:
ICE Score = (8 + 8 + 8) ÷ 3 = 8.0
The NPS survey scores lower on Impact but higher on Ease and Confidence. The checkout redesign has strong potential but receives a low Ease score because it requires considerably more resources.
The resulting score helps the team compare priorities. It does not mean the CTA test is guaranteed to produce a better business result.
ICE vs RICE vs PIE: Which Prioritisation Framework Fits?
ICE is designed for simple experiment prioritisation, while RICE adds Reach and PIE uses a different set of criteria.
| Framework | Factors | Typical use |
| ICE | Impact, Confidence, Ease | Fast growth experiment prioritisation |
| RICE | Reach, Impact, Confidence, Effort | Product and growth backlogs where audience reach varies |
| PIE | Potential, Importance, Ease | CRO and page-level prioritisation |
RICE was developed at Intercom as a prioritisation system using Reach, Impact, Confidence and Effort. Its Reach factor adds an explicit estimate of how many users or events an initiative affects over a defined period.
PIE uses Potential, Importance and Ease and is particularly associated with conversion rate optimisation.
The choice depends on the decision the team needs to make. A lightweight experiment backlog may benefit from fewer inputs, while a product backlog with large differences in audience reach may need more detail.
What are the Common Problems With ICE Scoring?
ICE becomes less useful when teams treat subjective scores as precise measurements.
Subjective Scores
Two marketers can look at the same experiment and give it different Impact or Confidence scores. Define the rubric before scoring and require evidence for major assumptions.
Score Inflation
If most experiments receive scores between 7 and 10, the framework stops separating priorities. Teams should use the full scale when the evidence supports it.
False Precision
A score of 8 is not necessarily meaningfully better than 7. The score is a structured comparison, not a measurement with scientific precision.
How Data and AI Can Make ICE Scoring More Consistent?
Data can make the reasoning behind ICE scores stronger, while AI can help teams organise and challenge that evidence.
For Impact and Confidence, teams can use:
- Conversion and funnel analytics
- Historical experiment results
- Customer research
- Product usage data
- Campaign performance
- Previous test outcomes
AI can help summarise research, compare an experiment hypothesis with historical results, identify missing evidence and flag inconsistent scoring across a backlog.
For example, if one experiment receives a Confidence score of 9 but has no supporting analytics or research, an AI-assisted review could flag the mismatch for the team to discuss.
AI should support the scoring process, not decide the scores without human review.
ICE Scoring Template
An ICE scoring template turns the framework into a repeatable workflow for experiment planning.
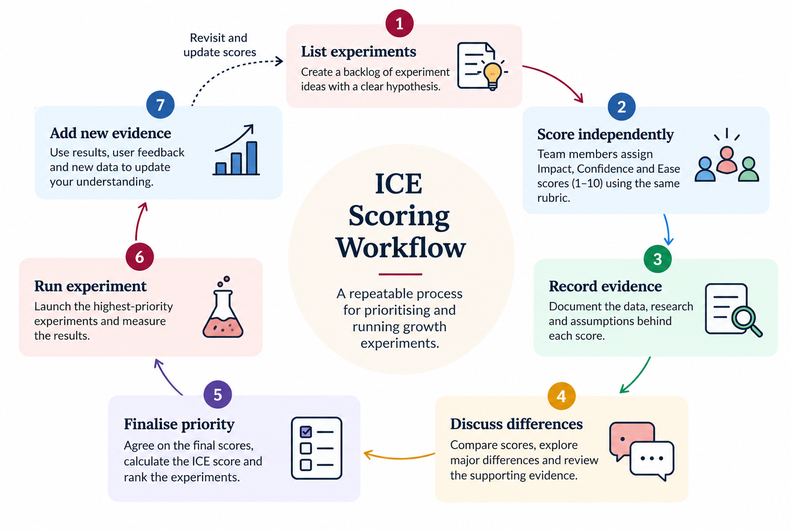
Use this structure:
| Experiment | Hypothesis | Impact | Confidence | Ease | ICE Score | Evidence / Notes | Priority |
| Experiment name | What you expect to happen | 1–10 | 1–10 | 1–10 | Average | Supporting evidence | Rank |
How to Use the ICE Template?
1. Score experiments independently.
Have team members score the ideas before discussing them to reduce early anchoring.
2. Record the evidence.
Write down why each Impact, Confidence and Ease score was assigned.
3. Discuss major differences.
If one person gives Confidence a 3 and another gives it a 9, examine the evidence behind the disagreement.
4. Finalise the score and priority.
Agree on the final scores using the same rubric for every experiment.
5. Revisit scores when new data appears.
A new customer insight, experiment result or implementation estimate can change an experiment’s priority.
The goal is not to create a perfect number. It is to make the reasoning behind prioritisation more visible and consistent.
Conclusion
The ICE framework gives growth teams a simple way to turn a long experiment backlog into a more structured priority list. By scoring Impact, Confidence and Ease, teams can make the reasoning behind their choices easier to discuss and compare.
Its value is not in producing a magically precise number. The real benefit comes from using the same criteria consistently, supporting scores with evidence and updating them as the team learns.
For teams that need more detail, RICE or other prioritisation methods can add factors such as Reach or Effort. The right framework is the one that matches the decision, data and level of complexity the team can realistically maintain.
Frequently Asked Questions About the ICE Framework
How many experiments should a growth team score with ICE?
There is no fixed limit. Start with the experiments that are realistic candidates for the team’s available testing capacity. Scoring a focused backlog is generally more useful than assigning numbers to ideas that cannot realistically be tested.
Should the ICE score be recalculated after every experiment?
Not necessarily. Recalculate when important information changes, such as new research, a failed dependency, a change in implementation effort or new experiment results that affect Confidence.
Can two teams use different ICE scoring systems?
Yes. Teams can define their own scoring conventions, including how the final score is calculated. The important requirement is to document the method and use it consistently when comparing experiments.
Should dependencies be included in an ICE score?
A dependency can affect Ease, but it should also be recorded separately. An experiment may have a strong ICE score but still be unable to launch until another technical or operational dependency is completed.
Can ICE prioritise experiments with different target metrics?
Yes, but comparisons become harder when the experiments target very different outcomes. Teams should define their primary growth objective before scoring so Impact is assessed against a clear target.
What should a team do when two experiments have the same ICE score?
Look at the evidence behind Confidence and Ease, then consider practical factors such as dependencies, timing, available traffic and learning value. The ICE score does not need to make every decision automatically.
Can an experiment with a low ICE score still be worth running?
Yes. An experiment may have strategic importance, provide essential learning or unblock another initiative even if its ICE score is low. The score should inform prioritisation rather than replace team judgement.
How can teams tell whether their ICE scoring is working?
Review past scores against actual experiment outcomes. Look for repeated patterns such as consistently overestimating Impact or giving most experiments high Confidence. This can help the team refine its scoring rubric over time.
Is ICE suitable for long-term product roadmaps?
ICE can be used for product ideas, but it is particularly lightweight for experiment backlogs. If a roadmap requires explicit Reach, Effort, dependencies or longer-term planning, a framework with additional inputs may provide more context.
Can ICE be used for non-marketing experiments?
Yes. The same logic can be applied to product, onboarding, retention, pricing or other growth experiments as long as Impact, Confidence and Ease can be defined against a clear objective.