
A/B Testing for Marketers: From Manual Experiments to AI-Powered Testing

If you have ever changed an email subject line, swapped an ad creative, or rewritten a landing-page headline and wondered which version actually worked, you have already used the basic idea behind A/B testing.
A quick note on scope before we go further: when marketers talk about A/B testing, they mean testing marketing assets — emails, ads, landing pages, offers — with real audiences, not the feature-flag or product experimentation that software teams run internally. Same core idea, different world. This article is about the marketing kind.
What is A/B testing in marketing?
A/B testing — also called split testing — compares a control version with a changed version and measures the difference in performance. The two versions are shown to comparable audiences, with one primary metric used to judge which one wins.
For a broader overview of A/B testing, see Wikipedia’s A/B testing overview.
Here is the basic setup:
| Element | What it means |
| Control (A) | The version you already use |
| Variant (B) | The version you want to test |
| Audience | Comparable groups exposed to A or B |
| Primary metric | The outcome you care about |
| Hypothesis | What you expect the change to improve |
For example, an ecommerce brand could test two email subject lines:
- A: “Your weekend wardrobe starts here”
- B: “20% off your weekend wardrobe”
If the goal is more site visits, click-through rate is the metric to watch. If the goal is more purchases, conversion rate matters more. Deciding what success looks like before you see the results is what separates an experiment from a guess.
How to run a marketing A/B test
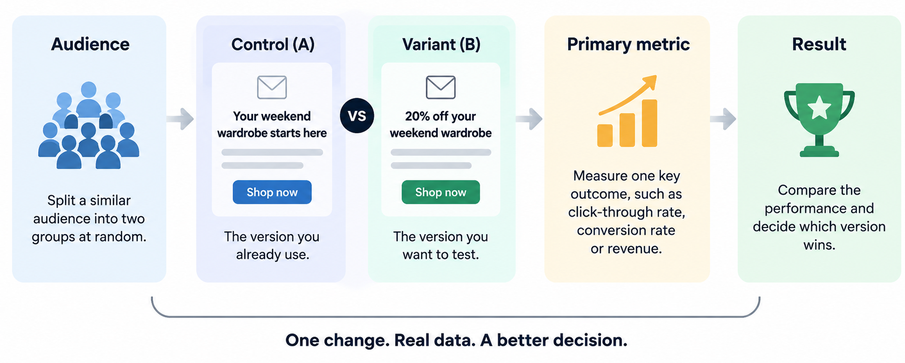
[Alt text: Anatomy of a marketing A/B test showing control and variant versions, primary metric, and test result.]
A good marketing A/B test starts with one clear question, runs on comparable audiences, collects enough data, and ends with a decision based on evidence rather than instinct.
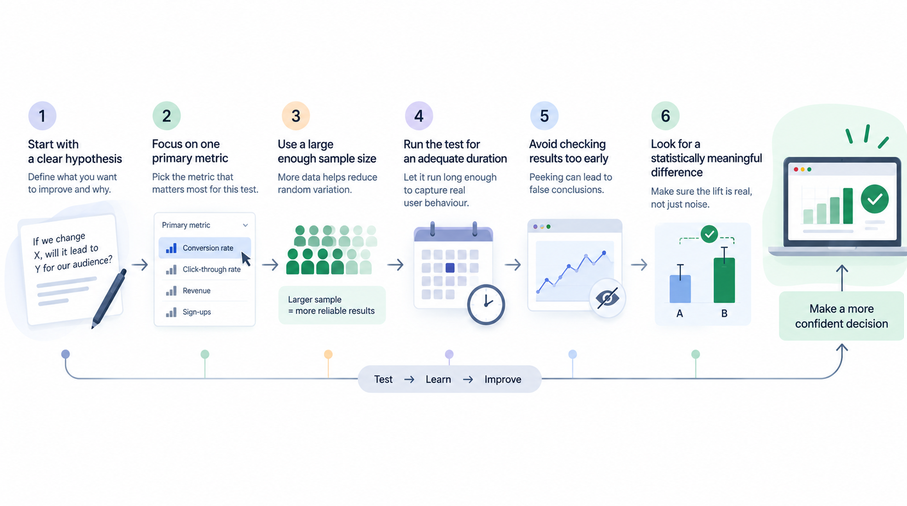
1. Start with a hypothesis and one metric
Do not begin with “let’s test something.”
Start with a specific idea about what might improve performance.
For example: A subject line that mentions the offer directly will increase click-through rate compared with the current subject line.
Then pick the one metric that will decide the test. Common choices:
- Click-through rate
- Conversion rate
- Sign-ups
- Purchases
- Revenue per visitor
You can still watch other numbers along the way, but a single primary metric keeps the test honest and stops you from picking whichever number happened to move.
2. Split the audience and plan the test
The two groups need to be genuinely comparable. If Version A goes mostly to returning customers while Version B reaches mostly new visitors, whatever difference you see may reflect the audience, not the change you made — so check how your traffic is being split before you launch, not after.
Sample size matters just as much. A test with very few observations can swing sharply on random noise alone, which is exactly what makes early results misleading.
Before launching, think about:
| Question | Why it matters |
| How much traffic do you have? | Determines how quickly you can collect data |
| What is your current conversion rate? | Gives you a baseline |
| How large a change matters? | Helps define the effect worth detecting |
| How long is the normal campaign cycle? | Helps avoid misleading short-term results |
A significance or sample-size calculator can handle the maths. You do not need to build the calculation yourself. Use this free A/B test calculator to check significance or estimate the sample size you need.
3. Run it long enough
There’s no fixed number of days for an A/B test; the right duration depends on your traffic, your conversion volume, the size of the effect you’re trying to detect, and the normal rhythm of your audience (weekday versus weekend behaviour, payday spikes, and so on).
A high-traffic campaign might reach a reliable sample in two days; a smaller one may need two to three weeks to say anything meaningful.
The most common way marketers undermine their own test is stopping the moment the dashboard looks exciting. If Version B jumps ahead on day two, treat that as an early signal worth watching, not a result worth acting on.
4. Read the result honestly
This is where statistical significance earns its keep.
It’s a measure of how likely the difference you’re seeing reflects a real effect rather than random variation; and it should be weighed alongside your sample size, how the test was designed, and what the result would mean for the business if you acted on it.
Take an example:
| Metric | Version A | Version B |
| Visitors | 10,000 | 10,000 |
| Conversions | 400 | 420 |
| Conversion rate | 4.0% | 4.2% |
B is ahead.
But the next question is not simply, “Which number is bigger?”
It is:
Is the difference large and reliable enough to act on?
That is why marketers should avoid calling a winner simply because one version is temporarily ahead.
What about peeking at the results?
Checking a live dashboard is normal.
Repeatedly checking the result and stopping the test the moment your preferred version pulls ahead is different. Early fluctuations can look much more convincing than they really are.
Set the testing conditions beforehand.
Then stick to them.
What do marketers actually A/B test?
Marketers commonly A/B test emails, ads, landing pages, pricing and offers. Here are a few examples by channel. The right test depends on which part of the customer journey you want to improve.
Emails
Marketers can test:
- Subject lines
- Preview text
- Calls to action
- Offers
- Send-time approaches
A simple subject-line experiment can reveal whether a more specific message gets more engagement.
Ads
Paid campaigns offer many variables to test:
- Creative
- Copy
- Images
- Calls to action
- Offers
- Audience approaches
For example, you could compare a product-focused creative with one built around a customer problem.
Landing pages
Landing-page experiments often focus on:
- Headlines
- Page layouts
- Forms
- Calls to action
- Images
- Offer presentation
The useful question is not “Which page looks better?”
It is “Which change improves the outcome we care about?”
Pricing and offers
Offers can also be tested.
You might compare two promotional messages or different offer structures. But conversion rate should not be viewed alone.
A higher conversion rate can come with lower revenue or margin.
The metric needs to match the business decision.
AI A/B Testing and multi-armed-bandit testing: What changes?
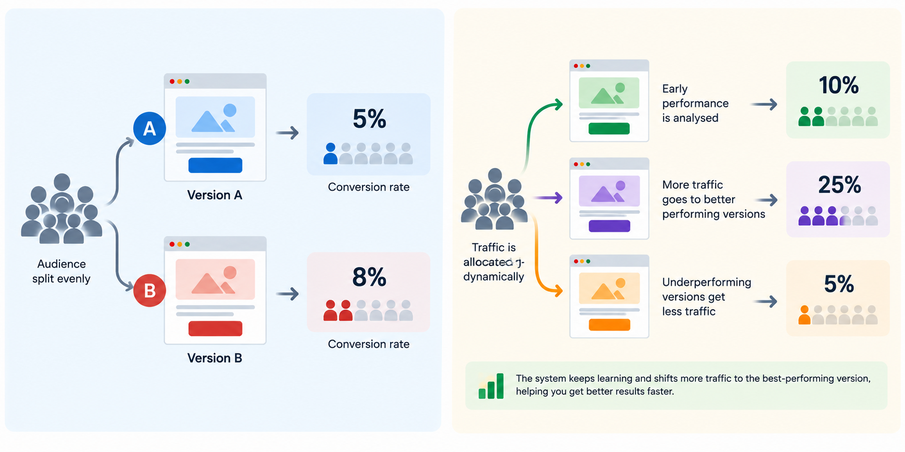
AI-powered and multi-armed-bandit approaches make experimentation more adaptive by using incoming performance data to change how traffic is allocated.
Traditional A/B testing generally keeps the comparison controlled while data accumulates.
A multi-armed-bandit approach takes a different route.
It can gradually send more traffic toward variants that appear to be performing better while continuing to learn about the alternatives.
Imagine you are testing three ad creatives:
| Approach | What happens |
| Classic A/B test | Traffic is controlled for a clean comparison |
| Multi-armed bandit | Traffic allocation adapts as performance data arrives |
| AI-powered experimentation | Algorithms can help automate parts of testing and optimisation |
This can matter when sending traffic to a weaker variant has a real cost.
For example, a paid campaign may benefit from shifting more traffic away from an ad that consistently underperforms rather than waiting until the experiment is completely finished.
But there is a trade-off.
A classic A/B test gives you a cleaner controlled comparison. A bandit approach puts more emphasis on learning and optimisation while the experiment is running.
So the question is not whether AI “replaces” A/B testing.
It does not.
The more useful question is: Do you need a clean comparison, faster optimisation, or a combination of both?
And AI cannot rescue a weak experiment.
A vague hypothesis, poor metric or tiny sample remains a problem no matter how clever the algorithm is.
Common A/B testing mistakes
Most A/B testing mistakes come from poor experiment design rather than complicated statistics.
| Mistake | What to do instead |
| Tiny sample | Estimate the required sample before starting |
| Too many changes | Keep the test focused on one meaningful variable |
| Stopping early | Set testing conditions before launch |
| Ignoring audience differences | Keep the groups comparable |
| Testing trivial details | Prioritise questions tied to business outcomes |
| Chasing every segment | Start with the overall result, then investigate useful segments |
One particularly common mistake is testing something simply because it is easy to change.
A button colour may be simple to test.
But if your bigger problem is a weak offer, a beautifully optimised button will not solve it.
Good experimentation starts with better questions.
Build a better experimentation practice
One A/B test can answer one question.
A consistent experimentation practice can reveal patterns across campaigns, audiences and the funnel.
That is where marketing experimentation becomes more interesting. The goal is not to run more tests for the sake of having more tests. It is to turn better questions into better decisions.
AI adds another layer.
Instead of treating experimentation as a manual process that starts and ends with a marketer reading a dashboard, teams can increasingly use adaptive systems to learn from live campaign data and adjust how traffic is distributed.
Running one clean test is easy; building an experimentation practice that compounds is the skill. Growth, Experimentation & Funnel Optimisation is Module 8 of the IIM Tiruchirappalli Certificate in AI-Powered Marketing & Growth Strategy (Varsity by InterviewBit). → [Varsity course URL]
Frequently asked questions about A/B testing
The questions below go beyond the basic definition and focus on issues marketers often face when planning or interpreting experiments.
1. What is the full form of A/B testing?
There isn’t a longer full form; A and B simply label the two versions being compared, control and variant.
2. Does Netflix use A/B testing?
Yes. Netflix publicly documents using experimentation to test changes to its product and user experience. Netflix Research specifically lists experimentation and causal inference as an area of work, while Netflix has also published examples of features being tested before wider rollout.
3. What is the difference between A/B testing and multivariate testing?
A/B testing compares two full versions against each other; multivariate testing changes several elements at once and measures how they interact. Multivariate testing gives you more insight into combinations but needs significantly more traffic to reach a reliable result.
4. What is the difference between QA testing and A/B testing?
QA testing checks whether something works correctly, while A/B testing measures how different versions perform with users. QA focuses on finding technical problems; A/B testing focuses on learning which variation produces a better outcome.
5. Can A/B testing be used for SEO?
An A/B test control group sees the existing version of a page, campaign or asset. It provides the baseline used to compare the performance of the new variation.
7. What is the difference between A/B testing and personalization?
A/B testing compares versions to learn which performs better across a test audience. Personalization changes the experience for different users based on characteristics, behaviour or context.
8. What is practical significance in A/B testing?
Practical significance asks whether a result is large enough to matter to the business, not just whether it is statistically detectable. A tiny improvement can be statistically significant without being worth implementing.
9. Can A/B testing be used for mobile apps?
Yes. Mobile app teams can A/B test elements such as onboarding flows, messages, offers, layouts and calls to action, then compare the chosen performance metric between user groups.
10. What is a good A/B testing hypothesis?
A good hypothesis connects one specific change to one measurable outcome. For example: “Changing the CTA from ‘Learn More’ to ‘Get Started’ will increase sign-ups.