Store Operations Meet AI: Smarter Inventory, Demand Planning and Fulfilment

What store operations actually means
Store operations is the day-to-day management of a retail store to ensure it runs efficiently, serves customers and remains profitable. It covers everything from receiving goods and managing staff to maintaining shelves, processing sales and closing the store.
Key responsibilities include:
- Inventory management: Ensuring stock availability and accurate stock records.
- Staff management: Scheduling employees and managing floor operations.
- Store maintenance and compliance: Keeping the premises functional, safe and compliant.
- Sales and cash reconciliation: Tracking daily sales, handling payments and balancing cash.
The operating day of a store, open to close
A store’s operating day follows a structured routine, from preparing the floor before opening to reconciling sales and setting up for the next day. Each stage requires coordination between staff, inventory, and customer demand to keep store operations running smoothly.
• Pre-open: shutter up, cash float counted into each till, gap-scan of empty facings, morning huddle on targets, promotions and section cover.
• Trading: stock moves from backroom to shelf in waves, queues are watched, and breaks are planned around footfall, not lunch.
• Peak: two or three hours usually produce a disproportionate share of the day’s bills, testing availability and staffing together.
• Close: tills reconciled, day-end POS report run, tomorrow’s indent raised, floor cleaned, shutter down.
• Key insight: almost every store problem is a timing problem. The stock existed, but not at 6 p.m. The staff existed, but not where the queue formed. The SKU existed, but it was still in the backroom.
• Each step is usually written down as an SOP for store operations.
The core functions of store operations
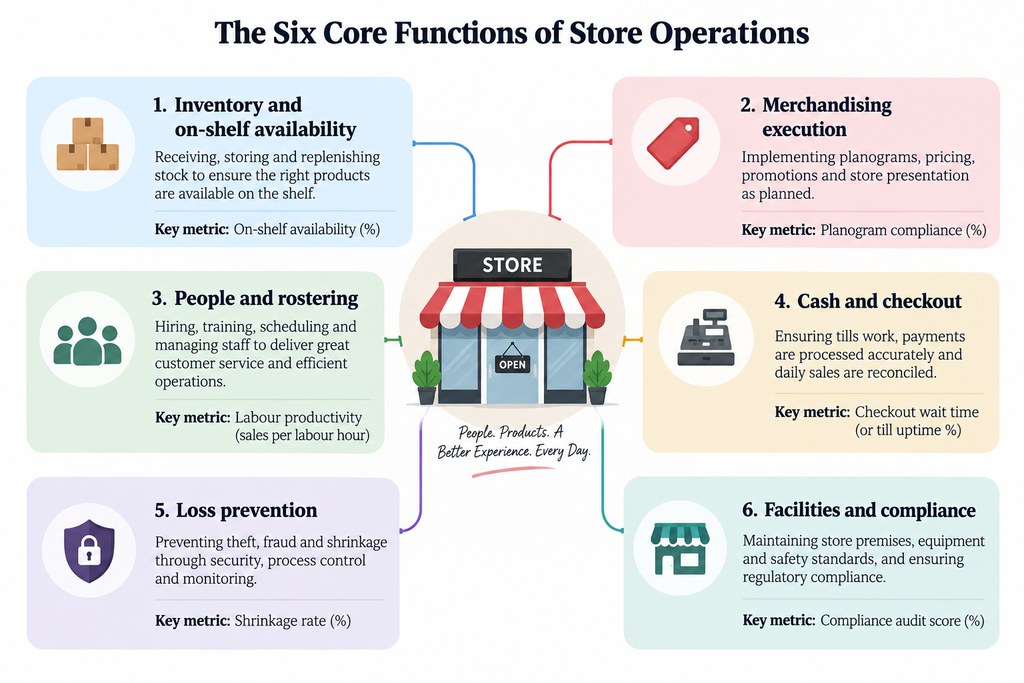
Store operations are built around six core functions that work together to maintain product availability, deliver a smooth customer experience, and keep the store running efficiently. Each function has specific responsibilities, performance measures, common challenges, and ownership.
• Six functions: inventory and on-shelf availability, merchandising execution, people and rostering, cash and checkout, loss prevention, facilities and compliance.
• Each is covered below by what it involves, how it is measured, what goes wrong and who owns it.
Inventory and on-shelf availability
• Involves: goods receipt against the invoice, backroom-to-shelf replenishment, gap scanning, cycle counts and the auto-indent that raises tomorrow’s order.
• Phantom inventory: the system says four units are in stock, so no replenishment order fires, yet the shelf is empty. The units are damaged, misplaced, mis-scanned at the till or stolen.
• Why cycle counts exist: system stock and shelf reality drift apart, so stores run small rolling counts of chosen aisles or SKUs alongside occasional full stock takes.
• On-shelf availability (OSA) = SKUs found on the shelf ÷ SKUs that should be there × 100.
• Out-of-stock rate = 100% − OSA.
• Replenishment forecast: the store checks tomorrow’s forecast-based order against shelf and backroom. How the forecast is built is a separate subject.
• Owner: store manager.
Merchandising execution and planogram compliance
• Planogram: a shelf-by-shelf, facing-by-facing plan of what goes where. Brands pay for placement, so compliance is measured (correctly placed facings ÷ planned facings), not assumed.
• Mechanism: a plan drawn at head office is executed by a store team under time pressure, so drift is the default.
• What goes wrong: wrong facings, expired promotional signage, shelf-edge labels that no longer match the till price, contested end-cap and gondola space.
• Owner: visual merchandiser or section manager.
People, rostering and the shift
• Involves: rosters built against forecast footfall, customer-facing vs back-of-house hours, shift handovers, training and SOP adherence, attrition.
• Rules: state Shops & Establishments rules limit hours and overtime.
• Trade-off: labour is a major controllable cost, yet conversion depends on staff being available. Cutting hours to protect margin can cost more in lost sales than it saves in wages.
• Measured by: labour cost as a percentage of sales, conversion, attrition.
• Owner: store manager.
Cash, checkout and billing
• Involves: POS, queue management, payment mix, cash float, returns and exchanges, day-end reconciliation, self-checkout where present.
• India specifics: every bill must be GST-compliant, and UPI has shifted reconciliation from counting cash towards matching payment-gateway reports.
• What goes wrong: peak-hour queues, price mismatches, unreconciled returns.
• Measured by: queue time, bill accuracy, cash variance.
• Owner: front-end supervisor.
Loss prevention and shrinkage
• Shrinkage: the gap between book stock and physical stock, usually as a percentage of sales. Some chains use stock value as the denominator, so state which.
• Known loss: damage, expiry, markdowns.
• Unknown loss: external and internal theft, administrative errors, receiving errors.
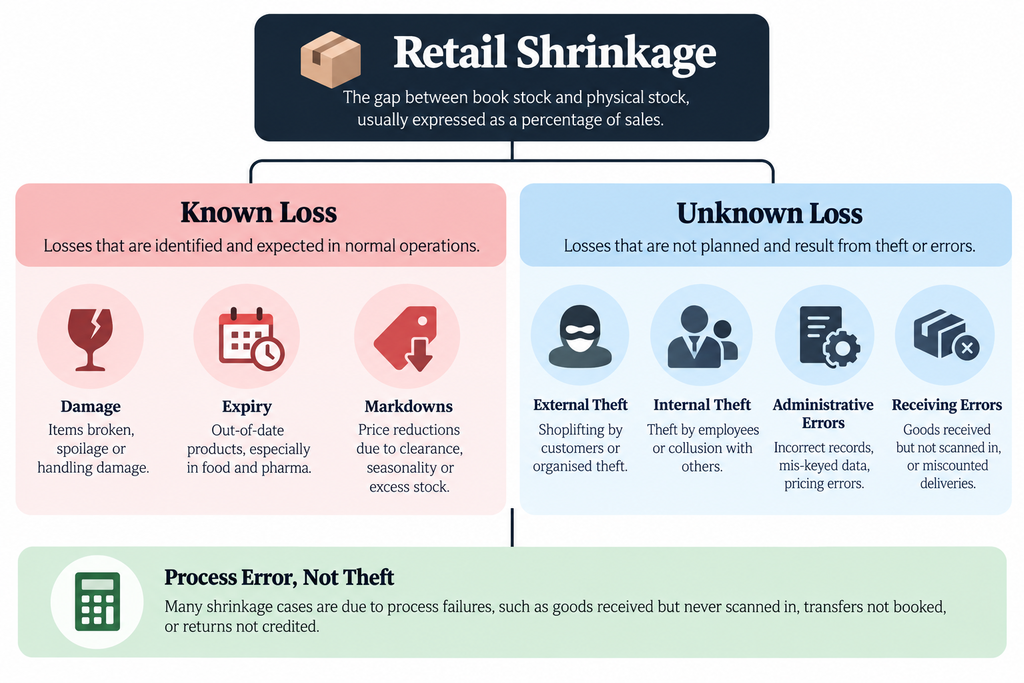
• Process error, not theft: goods received but never scanned in, transfers not booked, returns not credited.
• Controls: CCTV and EAS tags deter, but process controls recover more: blind receiving, signed transfers, authorised returns, regular counts.
• Figures: shrinkage rates vary by format and country, so none are quoted here.
• Owner: loss-prevention officer or store manager.
Facilities, safety and compliance
• Involves: store upkeep, refrigeration in food formats, energy, fire safety, signage, licences.
• 5S housekeeping: sort, set in order, shine, standardise, sustain.
• Licences by format: FSSAI for food; Legal Metrology for packaged-commodity declarations and weighing equipment; state Shops & Establishments registration.
• Note: fees and renewals change, so check the issuing authority.
• Owner: store manager, with facilities staff.
The metrics a store is judged on
Sales alone cannot diagnose store operations: a store can miss its number because fewer people walked in, fewer bought, baskets shrank or stock was missing.
• Each cause sits with a different function, so every metric below has a formula and a reading of what a bad number means.
• Formulas use net sales unless stated. Targets are omitted because they are format-specific.
• Context matters: 3% conversion reads very differently in a supermarket, where most visits are shopping trips, than in a jewellery store, where many are browsing.
| Metric (what it measures) | Formula | Bad reading usually means → function responsible |
| Traffic and conversion | ||
| Footfall : people entering | Door-counter entries, staff excluded | Weak location or marketing pull → Marketing, site |
| Conversion rate : visits becoming bills | Transactions ÷ footfall × 100 | Falling conversion on steady footfall: staffing or availability → People, Inventory |
| Bill cuts : bills raised | Completed bills in period, net of voids | Fewer customers or buyers → Whole store |
| Dwell time : time in store | Average of (exit time − entry time) | Too short: little to buy. Too long: queues → Merchandising, Checkout |
| Basket | ||
| ATV : spend per bill | Net sales ÷ transactions | Weak add-on selling → Merchandising, People |
| UPT : items per bill | Units sold ÷ transactions | Poor cross-selling or stock-outs → People, Inventory |
| Basket size : bill breadth (some chains use value, which is ATV) | Invoice lines ÷ transactions | Single-item trips → Merchandising |
| Space and stock productivity | ||
| Sales per sq ft : space yield | Net sales ÷ selling area, per period | Poor layout or slow ranges → Merchandising |
| GMROI : margin earned on stock | Gross margin ÷ average inventory at cost | Thin margin or heavy stock → Inventory, Merchandising |
| Stock turns : speed of stock | Cost of goods sold ÷ average inventory at cost | Overstock or slow SKUs → Inventory |
| Sell-through: stock sold in a period | Units sold ÷ (opening units + units received) × 100 | Wrong range, price or placement → Merchandising |
| Markdown % of sales: discount reliance | Markdown value ÷ net sales × 100 | Over-ordering or late clearance → Inventory, Merchandising |
| Execution and cost | ||
| On-shelf availability: product on the shelf | SKUs found ÷ SKUs expected × 100 | Phantom stock or slow replenishment → Inventory |
| Shrinkage % : unexplained stock loss | (Book stock − physical stock) ÷ net sales × 100 | Receiving errors, theft, booking gaps → Loss prevention |
| Labour cost % of sales : labour efficiency | Store labour cost ÷ net sales × 100 | Overstaffing or falling sales → People |
| Audit / mystery-shop score : SOP adherence | Points earned ÷ points possible × 100 | Standards drifting → Store manager |
| NPS : customer advocacy | % promoters (9–10) − % detractors (0–6) | Service or availability failures → Whole store |
• Career link: retail MIS and store-analytics teams usually maintain these dashboards, and store executives with SQL skills often move towards them.
When the store becomes a fulfilment node
A store can now also fulfill online orders, which changes how it runs.
In-store fulfilment for online orders
• BOPIS / click-and-collect: customer orders online and collects in store.
• Ship-from-store: the store packs and dispatches online orders.
• Endless aisle: ordering an item the store does not stock.
• Online returns in store: returns of online purchases accepted at the counter.
• The conflict: a picker walking the aisles during trading hours competes with customers for the same stock and floor space. A unit promised online but sold to a walk-in becomes a cancellation.
• What changes: pick lists, a staging area, a separate handover counter, and inventory accuracy that is now customer-facing rather than internal.
Dark stores and quick commerce: a new kind of store operation
• Definition: a retail-format space that is closed to customers, sited for delivery-time coverage, stocked with a deliberately limited assortment and laid out for picking speed rather than browsing.
• It changes nearly every operating decision, as the comparison below shows.
| Dimension | Conventional store | Dark store |
| Customers | Walk in, browse, ask staff | None on premises; app orders |
| Assortment breadth | Broad, built for discovery | Limited, weighted to frequent essentials |
| Layout logic | Customer flow and display | Pick path and pick speed |
| Staffing shape | Sales floor, tills, back-of-house | Pickers, packers, dispatch, rider handover |
| Key metrics | Footfall, conversion, ATV, sales per sq ft | Orders per store per day, pick time |
| What “peak” means | Busy trading hours and festivals | Order bursts that overload picking and handover |
Conventional Retail Store vs Quick-Commerce Dark Store
| Aspect | Conventional Retail Store | Quick-Commerce Dark Store |
| Assortment | Wide range of products and brands to meet varied customer needs. | Narrower, high-demand assortment focused on fast-moving essentials. |
| Layout | Designed for customer browsing, with shelves, displays and signage. | Designed for fast picking and packing, with high-density storage and no customer shopping area. |
| Staffing | Store managers, sales associates, checkout staff and visual merchandisers. | Pickers, packers, inventory staff and operations supervisors. |
| Customer interaction | Direct, in-person interaction with customers. | No direct customer interaction; orders are placed online. |
| Order fulfilment | Customers select products and pay at checkout. | Staff pick and pack online orders for home delivery. |
| Location | High-footfall areas such as malls, high streets and shopping districts. | Urban areas close to customers, often in low-rent commercial spaces. |
| Key performance metrics | Sales per sq. ft., footfall, conversion rate, average basket value and customer satisfaction. | Order accuracy, picking time, orders per hour, fulfilment cost per order and on-time delivery rate. |
| Purpose | Drive in-store sales and deliver a positive customer experience. |
• Source: Swiggy Q1 FY27 shareholder letter , quarter ended 30 June 2026.
- Instamart had 1,171 dark stores across 131 cities.
- Active dark-store area was over 4.9 million sq ft, about 4,200 sq ft per store by division.
- Orders per dark store per day were 1,089, against 985 a year earlier.
- Store utilisation was about 40%.
• How to read it: rising store count with flat orders per store suggests coverage is being bought, and each store’s workload barely moves.
• Rising orders per store presses on picking, packing and rostering.
• Instamart’s stores and orders per store each rose roughly a tenth in a year, so both effects were present. This is a reading aid, not a universal rule.
• Stock inflow: stock reaches a dark store through the operator’s network, a separate subject.
• Balance: dark stores suit small, dense, high-frequency baskets. Large or considered purchases are different, and conventional stores still serve a distinct purpose: seeing, trying and being advised.
What makes store operations in India different
• Organised retail beside general trade: neighbourhood kiranas carry lower overhead, extend informal credit and deliver on a phone call, which shapes a modern store’s assortment, pricing and service.
• Compliance at store level (operating tasks):
– GST invoicing: correct tax mapping at the till.
– E-invoicing: covers B2B and export supplies above ₹5 crore aggregate turnover (Notification 10/2023-Central Tax, from 1 August 2023, per the GST e-invoice portal, checked September 2026). Confirm current applicability.
– Legal Metrology: check declarations at receiving and keep scales verified.
– FSSAI: licence display, temperature control, expiry discipline.
– Shops & Establishments: rules frame rostering.
• Payment mix: NPCI product statistics show UPI at 24.51 billion transactions worth ₹29.82 lakh crore in August 2026. At the till that means QR payments, reconciliation against gateway reports and a lighter cash-handling roster.
• Festive peaks: demand steps up rather than curves, so staffing, backroom capacity and replenishment frequency flex together. The peak is calendar-driven, so plannable.
• Multi-format, multi-language teams: SOPs that work in one language or format fail in another, so visual, format-specific SOPs and regional-language training keep execution consistent.
Where AI genuinely changes store operations
• Each example lists the manual task, the technique, what the system does now and what the person still owns. Anything else is emerging or vendor-reported.
Demand-driven replenishment and auto-indent
• Before: managers judged orders from memory and last week’s sales.
• Technique: a demand forecast (how it is built is a separate subject).
• System now: proposes order quantity, frequency and store-level safety stock; some SKUs may auto-order without review.
• Human now: decides what can be overridden. The real issue is decision rights, and what happens when every recommendation is overridden.
Computer vision for shelf and planogram monitoring
• Before: a manual gap-scan walked on a schedule.
• Technique: image recognition on shelf photos from fixed cameras, ceiling units or a staff phone, compared against the planogram.
• System now: flags gaps, wrong facings, planogram deviations and missing price labels.
• Human now: fixes flagged gaps instead of hunting for them.
• Limits: dense, visually similar SKUs and poor lighting reduce reliability; the system shows a gap exists without saying why.
• Claims: no accuracy or performance figures are made because none are sourced.
Labour forecasting, rostering and task allocation
• Before: uniform shift patterns covered the whole day.
• Technique: hourly footfall forecasts feeding a scheduling optimiser.
• System now: drafts shift plans, break schedules and task lists matched to the day’s shape.
• Human now: reviews the roster.
• Risk: a roster can look efficient but be unworkable for employees, and it must stay within statutory limits.
Loss prevention analytics, and where agentic systems are being tried
• Before: hand-reviewing transaction logs.
• Technique: anomaly detection over POS data; vision at self-checkout.
• System now: flags excess voids, refunds with no matching sale, discount patterns at one till, and scan avoidance.
• Human now: investigates. These are exception signals, not accusations, and many flags prove to be process errors.
• Agentic (emerging): task generation and escalation, auto-drafted store audits, natural-language questions about store performance. Treat as pilots or vendor claims unless a retailer names a production deployment.
Working in store operations: the roles, the ladder and the skills
• Titles differ by chain, but the ladder runs from running a shift to owning a region.
• The table shows what each role owns and how it is measured.
| Role | What they own | Measured on |
| Store Associate / Customer Service Associate | Customers, shelf, till | Service, billing accuracy |
| Department / Section Manager | One section | Section sales, OSA |
| Assistant Store Manager | Shifts, daily execution | Shift targets, audits |
| Store Manager | The store’s P&L | Sales, shrinkage, labour |
| Cluster Manager | Several stores | Cluster KPIs |
| Area / Regional Operations Manager | A region | Regional P&L |
| Retail MIS Executive | Store dashboards and reports | Accuracy, timeliness |
| Store Operations Analyst | Root-cause analysis | Insight quality |
| Merchandising Executive | Plan execution support | Planogram compliance |
| Loss-Prevention Officer | Controls, investigations | Shrinkage |
| Dark Store Manager | One dark store | Orders per day, pick time, availability |
| Picking Lead | A pick shift | Pick speed, accuracy |
| City Operations Manager | A city’s dark stores | Throughput, cost |
• What the job feels like: shift-based, floor-based, exception-driven and often weekend-heavy.
• Progression: running a shift, then owning a store’s numbers, then a cluster or region.
• The real shift: from executing SOPs to explaining and improving the store’s P&L.
• Skills that matter: Excel; SQL on POS and inventory data; comfort with POS, WMS or workforce tools; root-cause analysis; dashboard interpretation; process discipline; the confidence to challenge a forecast or an auto-indent.
Common ways store operations go wrong
• Each failure below follows one pattern: symptom, cause, fix.
• These seven recur across formats.
• Managing to system stock: phantom inventory leaves shelves empty with no reorders. Fix: cycle counts and gap-scans.
• Cutting labour hours: thin peak cover lowers conversion. Fix: protect peak hours and track conversion beside wages.
• Treating shrinkage as security: loss often starts as receiving and booking errors. Fix: audit receiving and transfers first.
• Auditing planograms too rarely: drift happens weekly, not quarterly. Fix: frequent, short checks.
• Staffing to average footfall: queues at peak, idle hours at trough. Fix: roster to the day’s shape.
• Bolting on online fulfilment: without its own stock, space or hours, cancellations and congestion follow. Fix: give picking its own.
• Judging a store on sales alone: availability, shrinkage and labour cost made the number. Fix: read all the metrics.
Next step: Store operations is where forecasting, automation and process design stop being theory and start being a shelf that is either full or empty. If you want to build that skill formally, the Certificate Programme in AI-Powered Operations & Process Transformation from IIM Tiruchirappalli covers predictive and prescriptive analytics, automation and agentic systems, and supply chain and asset operations , the module this article sits inside.
Frequently asked questions
What is store operations in retail?
Everything required to keep a store trading profitably each day: replenishing stock, keeping shelves correct, rostering staff, running tills and cash, preventing loss, and meeting safety and licensing rules. Merchandising decides what belongs on the shelf; store operations makes it actually be there.
What are the main functions of store operations?
Six: inventory and on-shelf availability, merchandising execution and planogram compliance, people and rostering, cash and checkout, loss prevention, and facilities and compliance. Many stores now run a seventh: fulfilling online orders from store stock, competing with walk-in customers for inventory.
What does a store operations manager do?
Owns a store’s or cluster’s numbers: sales and conversion, availability, shrinkage, labour cost and audit compliance. Day to day that means rosters, stock decisions, escalations and coaching. Promotion comes from moving beyond running shifts to explaining and improving the store’s P&L.
How is AI used in inventory management?
AI supports demand-driven replenishment by forecasting demand and recommending order quantities, order frequency and store-level safety stock. It can also flag shelf gaps and inventory discrepancies, while store managers review and override recommendations when needed.
What is the difference between store operations and retail operations?
In practice they are used interchangeably. Where a distinction is drawn, retail operations covers the whole chain, including central merchandising, supply chain and formats, while store operations is what happens inside the four walls of a single store, day to day.
What KPIs measure store operations performance?
Footfall and conversion rate, average transaction value, units per transaction, sales per square foot, stock turns and GMROI, on-shelf availability, shrinkage percentage, labour cost as a percentage of sales, and audit scores. Conversion and availability read together diagnose most store problems.
What is shrinkage in retail and what causes it?
The gap between book stock and physical stock. It splits into known loss (damage, expiry, markdowns) and unknown loss: theft plus administrative and receiving errors. A substantial share of apparent theft turns out to be process error that better controls recover.
What is a dark store and how is it different from a retail store?
A dark store is closed to customers and laid out for picking speed rather than browsing, with a deliberately narrow assortment sited for delivery-time coverage. It is judged on orders per store per day and pick speed, not footfall and conversion.
How can AI be used in demand forecasting and inventory management?
AI can forecast store-level demand and use those forecasts to recommend replenishment quantities, order frequency and safety stock. This helps stores improve availability and prepare orders while allowing managers to review recommendations and account for operational constraints.
How is AI used in store operations?
Most usefully in four places: demand-driven replenishment, computer vision that spots shelf gaps and planogram deviations, footfall-based labour forecasting for rosters, and transaction-log analytics that flag loss patterns for a human to investigate. Each replaces a manual check, not judgement.