
Web Analytics in Digital Marketing: Metrics, Tools and Setup


Web analytics in digital marketing is about understanding what happens when people reach your website, such as where they came from, what they did, and whether they took the action you wanted. It helps you see which campaigns bring useful traffic, where visitors lose interest, and what needs fixing.
The numbers are only useful when they change what you do next.
What is web analytics in digital marketing?
Web analytics is the record of what happens after someone lands on your site. Where they came from, what they clicked, whether they stuck around or bailed in four seconds flat.
People mix this up with “digital marketing analytics” a lot, which is the broader, messier umbrella term covering email, paid ads, CRM, social, the whole circus. Web analytics is the narrower cousin. It cares about your site. Just your site.
There are two broad ways to look at it:
- On-site analytics looks at what visitors do on your website, such as the pages they visit, actions they take and whether they convert.
- Off-site analysis looks at activity outside your website, such as search visibility or competitor activity.
None of this matters as a reporting exercise on its own. The value shows up in the loop: campaign sends traffic, site shows you what that traffic did, and you either fix something or double down. Rinse, repeat.
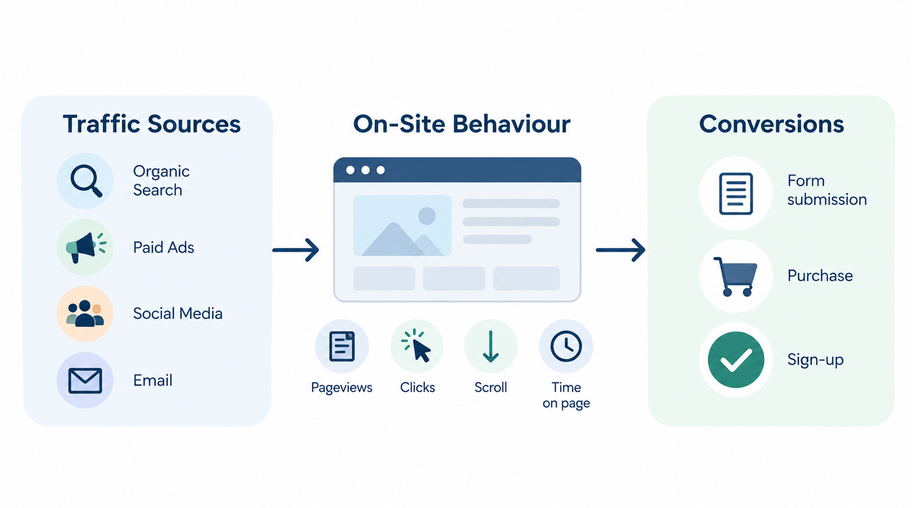
The web analytics metrics that matter
You don’t need dozens of metrics to start making sense of your website.
Begin with five questions: how many people came, where they came from, whether they engaged, what they did, and where they dropped off.
| Metric | What it tells you | Why it matters |
| Users | How many people visited your site | Shows how many people you reached |
| Sessions | How many visits your site received | Shows how much traffic your site got |
| Traffic sources | Where visitors came from | Shows which channels bring people to your site |
| Engagement rate | How often visitors meaningfully interacted with your site | Helps you see whether people actually engaged |
| Events and conversions | What important actions visitors took | Shows whether visits led to useful outcomes |
| Funnel drop-off | Where people leave during a multi-step journey | Helps you find where visitors are getting stuck |
GA4 uses an event-based measurement model. That means a button click, form submission or purchase can be tracked as an individual event. A user, a session and an event are measuring different things. Treating them as the same will muddy the picture.
Engagement rate deserves a mention on its own.
GA4 counts a session as “engaged” when it runs past 10 seconds, includes a key event, or covers at least two pageviews. In GA4, bounce rate is the percentage of sessions that were not engaged.
However, just because GA4 gives you a lot of numbers does not equal to more data and therefore, more insight.
A high session count from a paid campaign looks like a win until you notice nobody’s engaging or converting. At that point the real question isn’t “how much traffic,” it’s whether the ad, the audience, or the landing page is off.
How to set up and read web analytics in the GA4 era
A good analytics setup starts with a question you want answered, not a template you copy. Decide what you actually need to learn before you configure anything.
A basic setup can be surprisingly simple:
- Install GA4. Make sure data is coming through correctly before you start building reports or making decisions from it.
- Define what counts as success. Purchase for a store, demo request or form fill for a B2B site. Mark these as key events in GA4, and push the ones that matter into Google Ads as conversions.
- Tag campaigns with UTM parameters. These are small pieces of information added to campaign URLs that tell GA4 where the traffic came from, such as an email, social post or paid ad. It makes campaign performance much easier to separate later.
- Check the Traffic acquisition report. Compare channels side by side, looking at engagement and conversions rather than session counts alone.
- Build one dashboard, not twenty. A first dashboard worth keeping usuallycontains these metrics: users and sessions, traffic source, engagement rate, key events, top landing pages, and revenue where it applies.
Once it’s running, ask the same thing every time you open it: what changed, and what should I do about it?
For the technical detail, Google’s GA4 documentation is the reference that can help you further.
Web analytics tools
There’s no single best tool, because different tools answer different questions.
| Category | What it shows you | Examples |
| Analytics platforms | Traffic, acquisition, engagement, conversions | Google Analytics 4, Matomo |
| Tag managers | How tracking scripts get deployed | Google Tag Manager |
| Behaviour analytics | Clicks, scrolls, where people snag | Hotjar, Microsoft Clarity |
| Product analytics | Deeper in-product journeys | Amplitude, Mixpanel |
In practice, you may use more than one.
Most teams end up stitching two or three together. Your analytics platform flags that a landing page is bleeding visitors. Fine, but why? That’s where a heatmap earns its keep, showing exactly where someone’s cursor hovered, hesitated, and left.
So, one tool might tell you what happened. Another can help you understand why. Neither can replace the other.
How to actually use web analytics to improve marketing
A metric is only useful once it leads to a decision.
In practice, it may look like this:
- High traffic, low conversions:
Something’s off between the ad’s promise and the landing page’s delivery. Go check. - One channel outperforming the rest:
If one channel is bringing more engaged visitors or conversions, look at the audience, creative and landing page behind that performance before changing your budget. - A consistent funnel drop-off:
If visitors repeatedly leave at the same step, investigate that page or action.A confusing form or a broken CTA could be creating huddles. - Traffic without engagement:
If a page attracts visitors but they do not interact, compare what the ad or search result promised with what the page is actually delivering. - Two campaigns, similar traffic, different results:
Similar session counts don’t necessarily mean similar performance. Engagement and conversions tell you what happened after the traffic arrived.
This is also where the concept of attribution may get tricker.
Attribution is how marketers decide which channels or interactions should get credit for a conversion. For example, a customer might discover a brand through Google, return through an email and finally make a purchase after clicking a paid ad. Attribution helps analyse that journey.
One quirk worth knowing: GA4 can show different numbers for the same channel depending on whether you’re counting users or sessions. That is because the reports are showing you two different tallies: one is counting people, while the other is counting visits. That is not a bug.
The whole point ultimately boils down to this: stop asking what happened, start asking what you’re changing because of it.
Reading a site’s data well is where better campaigns start. Marketing Analytics, Measurement & Attribution is Module 4 of the IIM Tiruchirappalli Certificate in AI-Powered Marketing & Growth Strategy
Frequently asked questions
Do I need Google Analytics specifically, or will any tool do?
No single tool is mandatory. GA4 is a popular option, while platforms like Matomo track the same core behaviour. What matters is that you’re capturing sessions, sources and conversions somewhere at least.
How is web analytics different from SEO tracking?
SEO tools measure how you rank and what search terms bring people to your site. Web analytics picks up from there and tracks what those visitors do once they have arrived. They work best together, not as substitutes for each other.
What counts as a good engagement rate?
Depends too much on your industry and page type to hand you one number. Better move: watch your own trend, compare your pages against each other, skip the hunt for a universal standard.
Can a small business run web analytics without a dedicated analyst?
Yes. GA4’s default reports can cover many of the needs of a small team. The harder part is usually deciding which few metrics actually matter, not the technical install.
How often should marketers actually check their dashboards?
For many campaigns, a weekly review is a useful starting point. Check more often when you’re actively monitoring a launch or campaign, and focus on meaningful patterns rather than daily fluctuations.