
The Bullwhip Effect and Other Core Supply Chain Concepts

Key Insights
- Variability, not demand, is the problem. The bullwhip effect occurs when order fluctuations exceed customer-demand fluctuations upstream.
- Four classic causes drive it. Demand signal processing, order batching, price variations, and rationing or shortage gaming (Lee, Padmanabhan & Whang, 1997).
- It is common but not universal. Among 4,689 US public companies (1974–2008), two-thirds ordered more variably than they sold; 35% showed no bullwhip (Bray & Mendelson, 2012).
- Short-notice changes drive more amplification. Demand signals visible less than one quarter ahead accounted for 51% of the bullwhip, versus 30% for signals visible more than three quarters ahead.
- Better information has helped. Average bullwhip intensity fell by about one-third between 1974–1994 and 1995–2008 (Bray & Mendelson, 2012).
- Supply chain position matters. US data show a clear bullwhip in wholesale, but generally not in retail or most manufacturing industries; seasonal industries tend to smooth volatility (Cachon, Randall & Schmidt, 2007).
- Upstream firms suffer greater losses. In 2008, US retail sales fell 12%, versus nearly 30% for manufacturers. Dutch firms in tiers 3–4 reported 39–43% revenue declines, compared with 25% for tiers 1–2 (Sheffi, 2022).
- Simple supply chains amplify orders. In MIT’s Beer Game, factory peak orders exceed twice retail peaks, while average team costs reach $2,000 versus an optimal $200 (Sterman).
- Solutions focus on coordination. Share point-of-sale data, shorten lead times, order smaller quantities steadily, coordinate promotions, and plan collaboratively.
- Measurement is straightforward. Divide order variability by demand variability at each stage; a ratio above 1 indicates amplification.
The Bullwhip Effect and Other Core Supply Chain Concepts
The bullwhip effect is the pattern in which small changes in customer demand turn into progressively larger swings in orders and inventory as information travels upstream through a supply chain.
Goods typically move from suppliers to manufacturers, distributors, retailers and finally customers, while demand signals travel in the opposite direction. At each handoff, the signal can be distorted.
Several core supply chain concepts shape how far that distortion spreads, including demand forecasting, inventory management, lead time, safety stock and supply chain visibility. Together, they influence how businesses react to changing demand, coordinate replenishment and keep products available.
Understanding how these concepts connect helps organizations cut excess inventory, prevent stockouts and limit avoidable disruptions.
How does the Bullwhip Effect Work in a Supply Chain?
The bullwhip effect builds through a series of local decisions. Each supply chain participant orders based on the information it can see, which is often incomplete, delayed or already distorted by the stage below it.
As those orders pass upstream, a small change in customer demand can become a much larger fluctuation by the time it reaches the supplier.

How a Small Change in Customer Demand Amplifies Upstream?
Amplification happens in stages rather than all at once. Every business adds its own interpretation of demand before passing an order to its supplier, so the signal grows a little at each step. The sequence below shows how this unfolds.
- Customers purchase slightly more of a product than usual.
- Retailers increase orders to replenish inventory and protect shelf availability.
- Distributors interpret the larger orders as a stronger demand signal.
- Manufacturers increase production forecasts to match distributor orders.
- Suppliers receive larger material orders than actual customer demand justifies.
Why the Bullwhip Effect Occurs?
Most causes of the bullwhip effect are ordinary business practices that make sense for an individual company. The problem is that each one adds noise to the demand signal. The following ordering and information-sharing practices are the most common sources of amplification:
- Demand forecast updates at every stage: each business revises its forecast using the orders it receives, not actual consumer sales.
- Order batching and bulk purchasing: ordering in large weekly or monthly lots, often to cut transport or ordering costs, turns steady demand into spikes.
- Long or variable lead times: the longer the wait for stock, the more future demand buyers try to cover, magnifying every forecast change.
- Price promotions and temporary discounts: buyers stock up during deals and pause orders afterwards, creating artificial peaks and troughs.
- Shortage gaming: when supply looks tight, buyers inflate orders to secure a larger allocation, then cancel the excess later.
- Limited information sharing: upstream partners see orders rather than sell-through data, so they cannot separate real demand from noise.
Example of the Bullwhip Effect
A short illustration shows how a modest change grows. Suppose customer demand for a product rises by 5%. The example is illustrative only; the actual degree of amplification depends on each supply chain’s structure and ordering practices.
- Customer demand rises by 5%.
- The retailer orders more than the immediate increase requires to protect stock availability.
- The distributor increases its orders further to maintain its own buffer.
- The manufacturer expands production based on these inflated orders.
- Suppliers receive orders that substantially exceed actual end-customer demand.
Key point: The bullwhip effect is not simply a rise in demand. It is the amplification of demand variability as information moves through the supply chain.
What are the Core Supply Chain Concepts Related to the Bullwhip Effect?
The bullwhip effect is closely connected to how organizations forecast demand, manage inventory, coordinate replenishment and share information. Each of these supply chain management principles can either dampen or magnify demand distortion.
Understanding them explains why supply chains become unstable and how they can become more responsive.
Demand Forecasting
Demand forecasting estimates future customer demand using historical sales, seasonality and market signals. It is the starting point for every ordering decision, so any distortion in the forecast travels upstream with each order.
Forecasts that change sharply with every new order can amplify fluctuations, because each revision triggers fresh buffer adjustments further up the chain.
The most reliable input is actual end-customer demand, such as point-of-sale or consumption data, rather than the orders a business receives from the stage below it.
Inventory Management
Inventory management balances product availability against the cost of holding stock. When orders do not reflect real demand, a business can end up with too much of some items and stockouts of others at the same time.
Replenishment policies, such as how often to reorder and how much to order each time, decide whether a demand signal is passed on smoothly or exaggerated.
Inventory visibility matters too. A business that cannot see stock already in transit or held at other locations is more likely to over-order.
Lead Time
Lead time is the time between initiating a process, such as placing an order, and completing it, such as receiving the goods. The longer it is, the further ahead businesses must forecast and the more stock they hold to cover the gap.
When lead times are unpredictable, buyers respond with larger safety buffers and more reactive ordering.
Lead-time variability therefore adds a second layer of uncertainty on top of demand uncertainty, making distorted orders more likely across the supply chain.
Safety Stock
Safety stock is extra inventory held to protect against uncertainty in demand and supply. It is a legitimate buffer, but its size depends on assumptions about forecast error and lead-time reliability.
Poorly calculated buffers can push inventory well beyond what customers need, especially when several partners each hold their own.
The distinction is important: necessary protection covers realistic variation, while unnecessary overstocking covers fears created by distorted demand signals.
Supply Chain Visibility
Supply chain visibility is the ability to access relevant information about inventory, orders, shipments and demand across the supply chain. It gives each partner a view beyond its immediate customer and supplier.
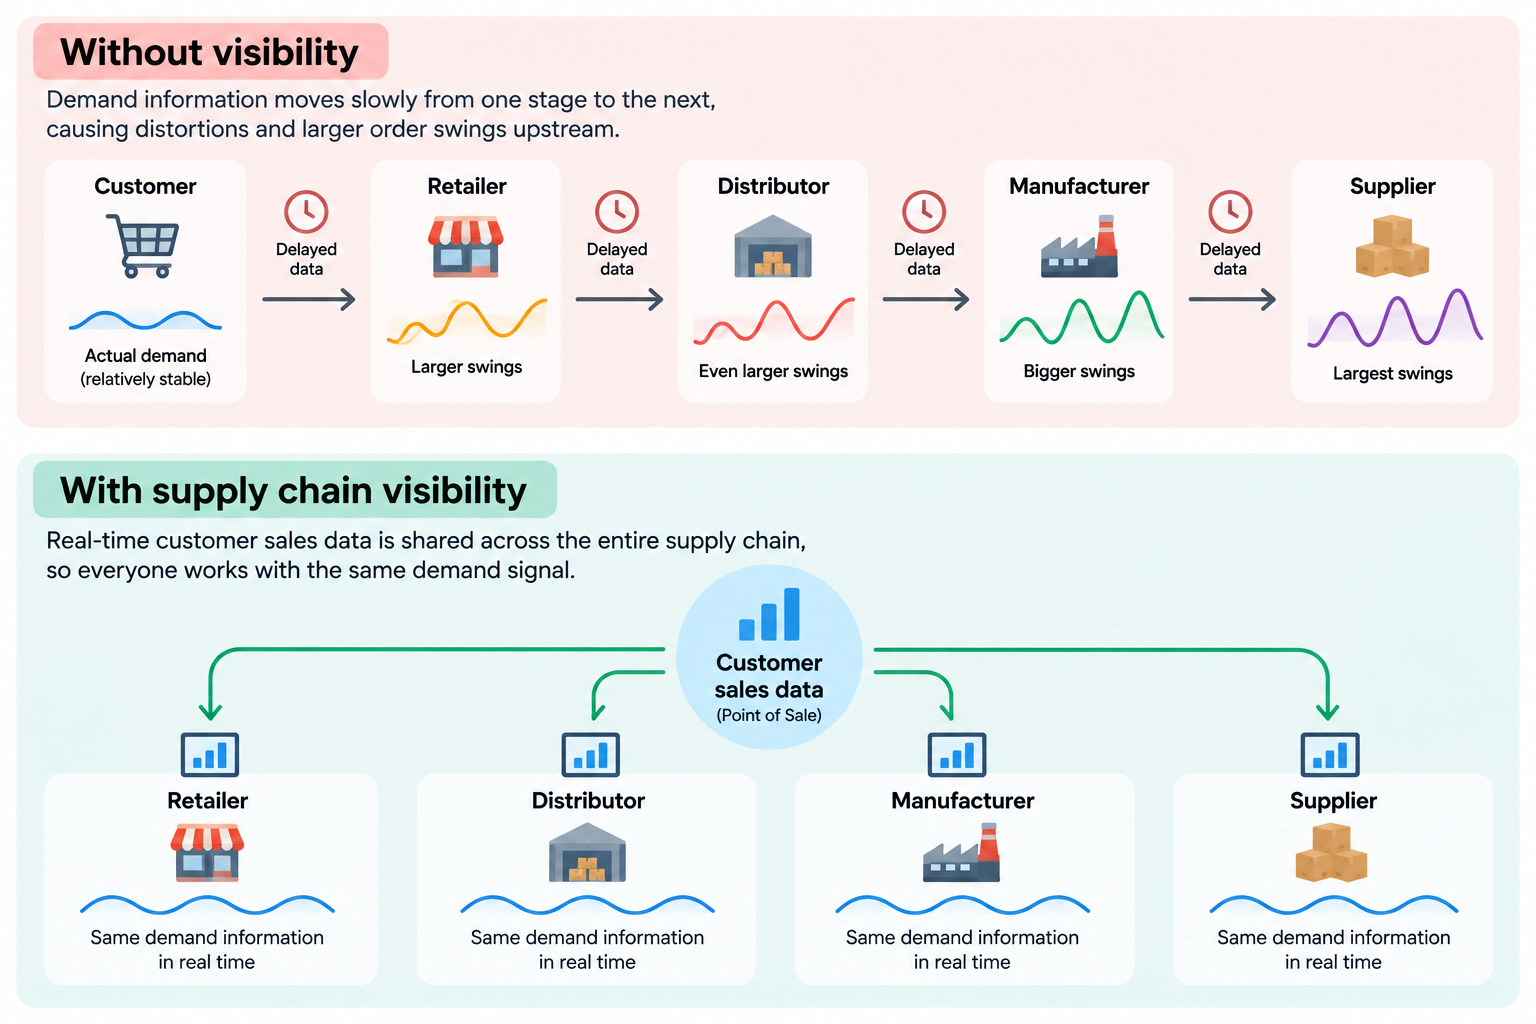
Shared data helps businesses respond to actual demand instead of guessing from order patterns.
Limited visibility has the opposite effect. Each stage reacts only to the orders that reach it, often after a delay, which leads to late decisions and distorted order signals.
Supply Chain Coordination
Supply chain coordination is the alignment of decisions among suppliers, manufacturers, distributors and retailers. Instead of optimizing each stage separately, partners plan around a shared view of demand.
In practice, coordination involves shared forecasts, agreed replenishment plans and synchronized ordering.
When every partner works from the same demand picture, there are fewer opportunities for individual stages to add their own exaggeration, which reduces unnecessary amplification.
Key point: These concepts are interconnected. Better forecasting, appropriate inventory buffers, shorter lead times and stronger visibility can help reduce the conditions that create the bullwhip effect.
What is the Difference Between the Bullwhip Effect and Other Supply Chain Problems?
The bullwhip effect is one type of supply chain challenge, but it is not the same as a stockout, overstocking, a supply disruption or a demand forecasting error. These problems often appear together, which makes them easy to confuse.
Distinguishing between them helps teams identify the underlying problem and choose the right response.
Bullwhip Effect vs Overstocking
Overstocking is often a symptom of the bullwhip effect, but the two terms are not interchangeable. One describes how orders behave across the supply chain; the other describes the state of inventory at a single point. The table below compares them across four dimensions.
| Area | Bullwhip Effect | Overstocking |
|---|---|---|
| Meaning | Demand variability amplifies upstream | Inventory exceeds what is needed |
| Nature | A supply chain behavior or pattern | An inventory condition |
| Main causes | Distorted signals, batching, forecast changes | Excess purchasing, weak planning, low demand |
| Relationship | Can contribute to excess stock | May occur with or without a bullwhip effect |
Bullwhip Effect vs Stockouts
A stockout occurs when required products are unavailable when needed. The bullwhip effect, by contrast, means orders fluctuate more than actual demand. The two can exist side by side in the same supply chain.
A manufacturer may hold large stocks built during an order surge while a retailer still runs out because replenishment was mistimed or stock sits in the wrong location.
In these cases, poor replenishment decisions, rather than a lack of total inventory, cause the stockout.
Bullwhip Effect vs Demand Forecasting Error
A demand forecasting error is the difference between forecast demand and actual demand. The bullwhip effect is the amplification of demand fluctuations across supply chain stages. One is a measurement gap; the other is a pattern across the chain.
Forecast errors can contribute to the bullwhip effect, especially when each stage forecasts from distorted orders.
However, they are not its only cause. Batching, promotions and shortage gaming can create amplification even when forecasts are reasonably accurate.
Bullwhip Effect vs Supply Chain Disruption
A supply chain disruption is an event that interrupts normal operations. Examples include supplier failures, transportation delays and natural disasters. A disruption is a trigger, while the bullwhip effect is a response pattern.
Disruptions can set off demand and ordering fluctuations, for example when buyers place extra orders because they expect shortages.
Still, the two are not synonymous. A disruption can occur without amplification, and the bullwhip effect can develop without any disruption.
How does the Bullwhip Effect Impact Supply Chain Performance?
When order variability exceeds actual demand variability, businesses struggle to plan production, maintain appropriate inventory and allocate resources efficiently.
The costs rarely stay in one place. They spread across inventory, customer service, production, procurement and logistics, affecting every partner in the chain.
Excess Inventory and Higher Holding Costs
Inflated orders often leave stock sitting in warehouses long after a demand spike has passed. That inventory carries costs well beyond its purchase price. The main financial effects include:
- Overstocking that increases storage space and handling requirements
- Capital tied up in inventory instead of being available for operations
- Higher risk of obsolescence, spoilage and waste
Stockouts and Poor Customer Service
The bullwhip effect can cause shortages as well as surpluses. Stock may be plentiful upstream but missing where customers need it, because replenishment does not follow real demand. This shows up as:
- Products unavailable despite high upstream inventory
- Delayed order fulfillment and growing backorders
- Reduced customer satisfaction and possible lost sales
Production and Capacity Instability
Manufacturers experience the bullwhip effect through erratic production plans. Swinging orders make it difficult to run plants at a steady, efficient rate. Common consequences include:
- Frequent changes to production schedules
- Manufacturing capacity that is underused in some periods and overloaded in others
- Higher overtime and changeover costs
Procurement and Supplier Challenges
Procurement teams inherit amplified signals and pass them further upstream. Suppliers, who sit farthest from the end customer, often receive the most volatile orders. Typical challenges include:
- Unpredictable raw-material orders
- Difficulty planning supplier capacity
- Higher costs from expedited shipments and rush purchasing
Reduced Supply Chain Efficiency
Beyond individual businesses, the bullwhip effect lowers the efficiency of the supply chain as a whole. Time and money are spent moving and storing goods that do not match demand. Key effects include:
- Unnecessary transportation and handling as stock is moved or rebalanced
- Higher operating costs across partners
- Poor coordination and strained relationships between supply chain partners
Key point: The bullwhip effect can create a mismatch between what customers actually need and what supply chain participants produce, purchase and store.
How can Businesses Reduce the Bullwhip Effect?
Reducing the bullwhip effect requires better demand information, coordinated ordering decisions and fewer practices that magnify short-term fluctuations.
No single tactic is enough on its own. The strategies below work best when supply chain partners adopt them together rather than in isolation.
Share Real-Time Demand and Inventory Data
The most direct fix is giving upstream partners access to the demand data retailers already see. When suppliers know what customers actually bought, they no longer need to infer demand from orders. Practical steps include:
- Provide downstream sales data to upstream partners
- Improve visibility into inventory and replenishment status
- Reduce dependence on order history as a proxy for customer demand
Improve Demand Forecasting
Better demand forecasting reduces the overreaction that drives amplification. The aim is a forecast that responds to genuine shifts in demand without chasing every short-term blip. Businesses can:
- Use actual sales and consumption data as the forecasting base
- Update forecasts systematically on a fixed cycle
- Separate temporary promotions from long-term demand trends
Reduce Lead Times and Lead-Time Variability
Shorter, more reliable lead times reduce how far ahead each stage must anticipate demand. That shrinks the buffers businesses feel they need and dampens reactive ordering. Useful actions include:
- Improve coordination with suppliers on delivery schedules
- Streamline order processing and approvals
- Reduce avoidable production and transportation delays
Optimize Order Quantities and Replenishment
Large, irregular orders are a major source of artificial demand spikes. Smaller, more frequent and more consistent orders give suppliers a smoother picture of demand. Businesses can:
- Reduce unnecessary order batching
- Use consistent replenishment policies across products and locations
- Align order quantities with demand patterns and inventory requirements
Coordinate Pricing and Promotions
Promotions often shift demand rather than create it, encouraging buyers to stock up early and order less later. Coordinated planning keeps these swings from distorting upstream forecasts. Recommended practices include:
- Avoid excessive short-term discounts that encourage forward buying
- Share promotional plans with suppliers and distributors
- Plan inventory against expected end-customer sales rather than expected trade orders
Use Collaborative Planning and Forecasting
Collaborative planning brings partners together to build a shared view of demand and supply. Approaches such as collaborative planning, forecasting and replenishment (CPFR) formalize this process. Core elements include:
- Coordinated forecasts between retailers, distributors, manufacturers and suppliers
- Agreed replenishment plans
- Joint review of major demand changes before orders are adjusted
Key point: The objective is not to eliminate all demand variation. It is to prevent unnecessary amplification caused by decisions, delays and poor information sharing.
What Role Does Technology Play in Managing the Bullwhip Effect?
Digital supply chain tools help organizations improve visibility, analyze demand patterns, coordinate replenishment and respond to change using more accurate and timely information.
Technology does not remove the bullwhip effect by itself. It works when it supports better decisions and closer data sharing between partners.
Supply Chain Management Systems
Supply chain management systems bring together data that is otherwise scattered across departments. A single, current source of planning information reduces the delays and mismatches that feed distorted orders. These systems:
- Connect purchasing, inventory, production and distribution data
- Support coordinated planning across business functions
- Improve access to order and inventory information
AI and Machine Learning for Demand Forecasting
AI and machine learning models can analyze large volumes of sales and market data to find patterns that manual methods may miss. Their value lies in helping planners separate real demand shifts from noise. They can:
- Identify demand patterns and seasonality
- Incorporate relevant sales and market signals
- Help planners detect unusual fluctuations early
Real-Time Inventory and Shipment Tracking
Tracking tools show where inventory sits and when replenishment will arrive. This visibility discourages duplicate orders placed simply because stock in transit could not be seen. Tracking helps businesses:
- Monitor stock levels across locations
- Track shipments and replenishment status
- Identify delays before they create larger planning problems
Predictive Analytics and Scenario Planning
Predictive analytics and scenario planning let teams test decisions before committing to them. Planners can see how a change in demand or lead time might ripple through inventory and orders. These tools help to:
- Model changes in demand and lead times
- Evaluate inventory and replenishment decisions
- Estimate the impact of different supply chain scenarios
Supplier and Retailer Data Integration
Data integration links the systems of different companies so information flows between them automatically. It turns supply chain visibility from an occasional report into a routine part of planning. Integration can:
- Share sales and inventory information
- Improve coordination between supply chain partners
- Reduce fragmented planning and duplicated buffers
When end-customer sales data reaches every stage at the same time, each partner plans from the same signal instead of a delayed, filtered version of it.
What are the Key Metrics for Measuring the Bullwhip Effect?
Businesses can monitor demand and order variability at different supply chain stages to see whether ordering patterns are becoming more volatile than actual customer demand.
Supporting metrics then show whether that volatility is affecting inventory, lead times and service. The measures below are most useful when reviewed together.
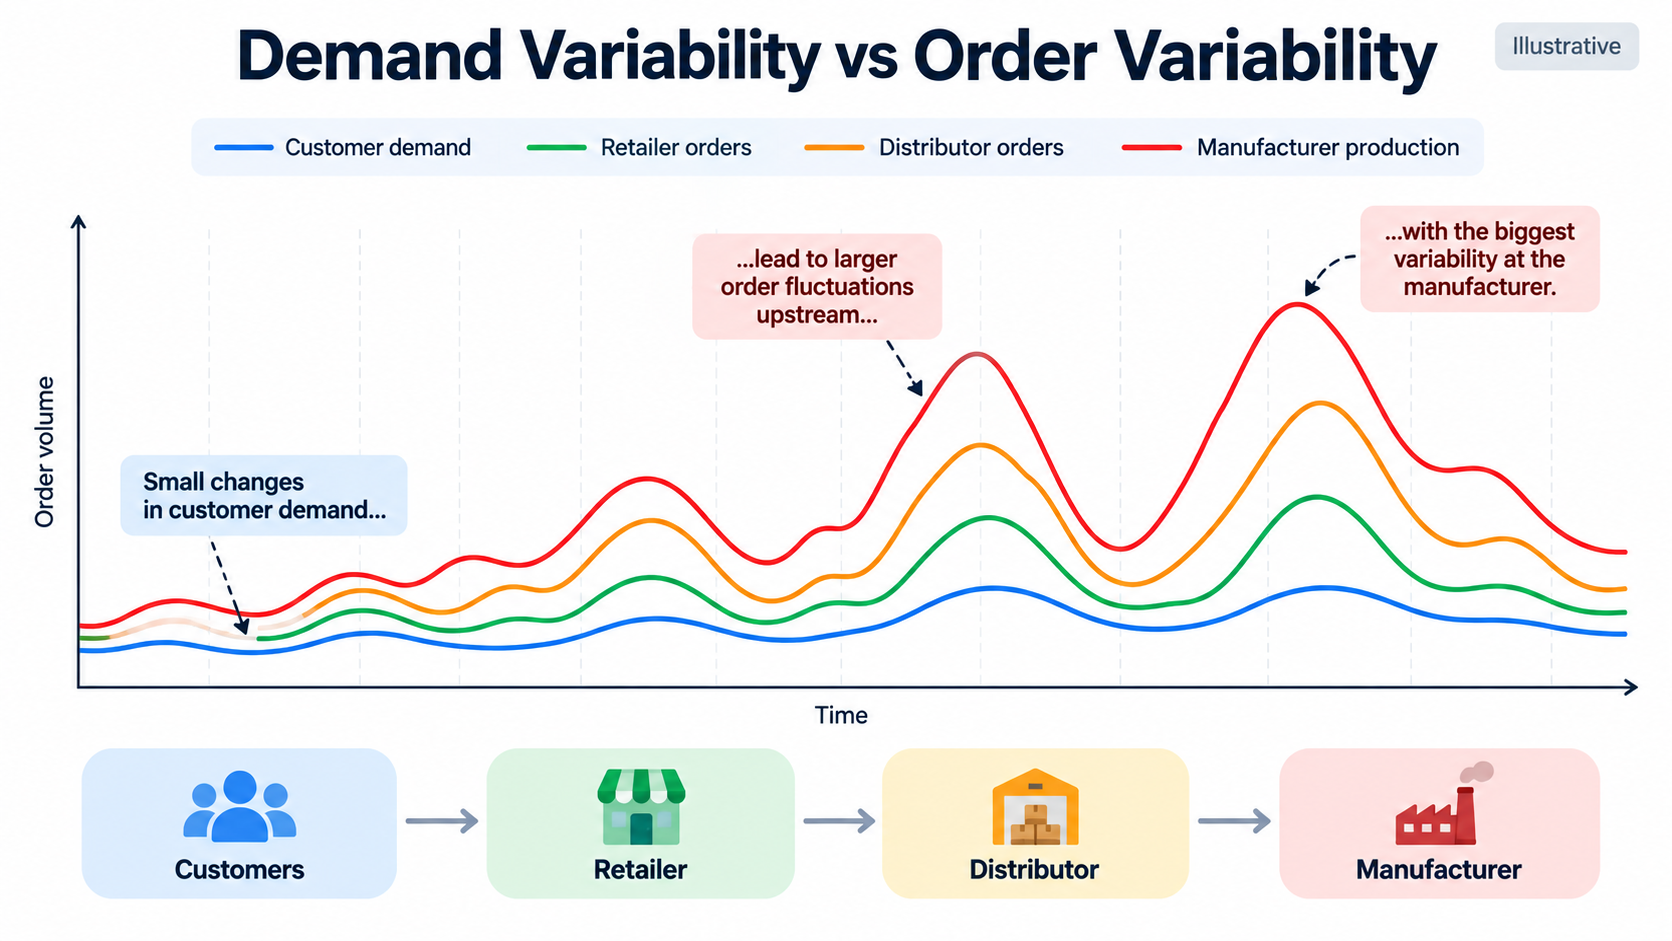
Demand Variability vs Order Variability
This comparison is the core bullwhip measure. If the orders a stage places vary more than the demand it receives, amplification is taking place at that stage. To use it effectively:
- Compare changes in actual customer demand with changes in orders at each upstream stage
- Identify where amplification begins
- Track changes over consistent periods, such as weekly or monthly
Inventory Turnover
Inventory turnover measures how quickly inventory is sold or consumed and replenished. Falling turnover can indicate that inflated orders are building stock faster than customers buy it. Use it to:
- Identify slow-moving stock and possible overstocking
- Spot products where inventory is rising faster than sales
- Interpret turnover alongside service levels and product availability
Forecast Accuracy
Forecast accuracy shows how closely forecasts match actual demand. Persistent errors encourage reactive ordering, which in turn feeds amplification further up the supply chain. Planners should:
- Compare forecasts with actual demand
- Monitor forecast error over time
- Identify products or periods with recurring inaccuracies
Lead-Time Variability
Lead-time variability measures how much actual replenishment times differ from expected times. Unreliable lead times push businesses to hold more stock and order more defensively. Track it to:
- Measure differences between expected and actual replenishment times
- Identify unreliable suppliers or process bottlenecks
- Assess how delays influence safety stock requirements
Order Fulfillment and Service Levels
Service metrics show whether inventory decisions actually help customers. A supply chain can hold more stock than ever and still deliver poor service if that stock is in the wrong place. Key measures include:
- On-time, in-full (OTIF) delivery performance
- Stockouts and backorders
- Whether inventory changes improve customer outcomes
Key point: No single metric fully explains the bullwhip effect. Businesses should compare demand and order variability while monitoring inventory, lead times, forecast accuracy and service performance.
Bullwhip Effect Example: A Retailer, Distributor and Manufacturer
A simple product example illustrates how ordering decisions at each supply chain stage can magnify a small change in customer demand.
Consider a retailer selling a household appliance, supplied by a regional distributor that buys from a single manufacturer. The steps below follow one demand cycle from rise to reversal.
Step 1 : Customer Demand Increases
The retailer sees a modest increase in weekly sales of the appliance. Concerned about running out, it raises its next replenishment order by more than the sales increase to rebuild a comfortable buffer. From the retailer’s point of view, this is a sensible decision.
Step 2 : The Distributor Increases Its Orders
The distributor sees only the retailer’s larger order, not the underlying sales data. It interprets the order as stronger demand and, to protect its own service level, increases its order from the manufacturer by an even larger amount.
Step 3 : The Manufacturer Expands Production
The manufacturer updates its production plan based on the distributor’s orders. It schedules additional production runs and purchases extra raw materials from its suppliers. Capacity and cash are now committed to a demand level customers never reached.
Step 4 : Demand Returns to Normal
Customer sales stabilize or decline after the brief rise, and the retailer, now holding surplus stock, reduces future orders. The distributor and manufacturer may be left with excess inventory or unused capacity as the drop in orders travels upstream just as the rise did.
What could Have Prevented the Amplification?
Each business acted reasonably with the information it had. The amplification came from gaps in information and coordination rather than from any single poor decision. These measures would have limited it:
- Shared customer sales data, so the distributor and manufacturer could see real demand
- More consistent replenishment rules in place of reactive order increases
- Shorter and more reliable lead times, reducing the need for large buffers
- Better coordination of forecasts and inventory plans across all three businesses
Transform Supply Chain Operations with AI
Discover how AI can improve demand forecasting, streamline operational workflows, and support data-driven decisions with the Certificate Programme in AI-Powered Operations & Process Transformation by IIM Tiruchirappalli.
Explore the programme and take the next step towards smarter, more efficient operations.
Frequently Asked Questions About the Bullwhip Effect and Supply Chain Concepts
How can businesses calculate the bullwhip effect in a supply chain?
Businesses calculate it by comparing the variability of the orders a stage places with the variability of the demand it receives over the same period. Variability is usually measured as variance or as the coefficient of variation.
Repeating the calculation at each stage shows where amplification starts and how much each partner adds.
What is the bullwhip effect ratio, and how is it interpreted?
The bullwhip effect ratio divides order variability by demand variability for a single stage. A ratio above 1 means the stage amplifies fluctuations, a ratio close to 1 means it passes demand through largely unchanged, and a ratio below 1 means it smooths demand.
Ratios are only comparable when they use the same time periods and product groups.
How does demand variability differ from order variability in supply chains?
Demand variability shows how much end-customer purchases change over time. Order variability shows how much the orders placed with suppliers change.
The gap between the two comes from ordering decisions such as batching, buffers and forecast revisions, which is why comparing them reveals the bullwhip effect.
How can vendor-managed inventory improve supply chain stability?
Under vendor-managed inventory (VMI), the supplier monitors the customer’s stock and sales data and decides when and how much to replenish. This removes one ordering layer and lets the supplier plan from actual consumption rather than from the customer’s orders.
VMI works best when both parties agree on stock targets and share reliable data.
What is the role of economic order quantity in reducing supply chain fluctuations?
Economic order quantity (EOQ) calculates the order size that balances ordering costs against holding costs, which brings consistency to replenishment.
However, when fixed ordering costs are high, EOQ can favor large, infrequent orders that create batching spikes. Lowering ordering costs allows smaller, smoother orders.
How does the bullwhip effect affect cash flow and working capital?
Inflated orders tie up cash in inventory, storage and production capacity that customers do not need, which weakens working capital.
When demand falls, surplus stock may have to be discounted or written off. Upstream firms are often hit hardest because they commit to materials and capacity just before orders drop.
Can a supply chain experience the bullwhip effect without changes in customer demand?
Yes. Order batching, price promotions and shortage gaming can create order swings even when consumption is steady.
Simulation research shows how little change is needed: in MIT’s Beer Game, customer demand rises once, from four to eight cases a week, and then stays constant, yet players’ orders swing widely and inventories overshoot.
How can businesses distinguish seasonal demand changes from bullwhip-driven fluctuations?
Seasonal changes recur at predictable times and appear in end-customer sales year after year. Bullwhip-driven fluctuations show up in orders but not in sales, or are far larger in orders than in sales.
Comparing seasonally adjusted sales with order data at each stage helps separate the two.
What role do distributors play in amplifying the bullwhip effect?
Distributors sit between retailers and manufacturers, so they often see neither actual consumer sales nor the manufacturer’s constraints. When they forecast from retailer orders, consolidate orders into larger batches and add their own safety stock, they can amplify the signal significantly.
Research on US industry data has found the effect most clearly in wholesale industries.
How can suppliers and retailers share data without compromising sensitive business information?
Partners can share only the data needed for planning, such as product-level sales and inventory, rather than margins or customer details. Data-sharing agreements, role-based access and aggregated data help protect sensitive information.
Many partnerships start with a limited pilot on selected products before expanding.
How does the bullwhip effect differ across food, retail, and manufacturing supply chains?
In food supply chains, perishability means excess stock quickly becomes waste, and promotions often trigger forward buying. Retail supply chains face strong seasonal peaks, and firm-level research found retailers were the only sector without an average bullwhip, largely because they smooth seasonal swings.
Manufacturing supply chains feel amplification mainly through production schedules, capacity and raw-material orders.
What strategies can businesses use to reduce the bullwhip effect during peak shopping seasons?
Plan peak inventory early with partners, using last season’s sell-through data and agreed forecasts. Share promotional calendars, stagger orders instead of placing one large batch, and agree on allocation rules in advance to discourage shortage gaming.
After the peak, monitor sales closely and taper orders gradually rather than cutting them abruptly.