Manufacturing and Production Operations: Process and Optimization

Key Insights
- Manufacturing is part of production operations. Manufacturing converts materials into finished goods; production operations also cover planning, scheduling, quality control and output management.
- Production methods balance cost and flexibility. Job, batch, mass and continuous production suit different volumes, product varieties and changeover costs.
- Production planning and control is continuous. The Plan → Schedule → Execute → Monitor → Correct cycle aligns output with capacity. US manufacturing capacity utilisation was 75.7% in August 2026, below its 1972–2025 average of 78.2%.
- Balanced metrics reveal performance. OEE, cycle time, throughput, first-pass yield, unit cost, on-time delivery and WIP show whether improvements create trade-offs.
- Optimization must target bottlenecks. Lean, Six Sigma, the Theory of Constraints, line balancing and changeover reduction improve output by addressing limiting steps.
- Maintenance failures are costly. NIST estimated preventable maintenance issues cost US discrete manufacturers $119.1 billion in 2016. Plants relying most on reactive maintenance had 3.3 times more downtime and 16 times more defects.
- Automation needs integration. Global industrial robot installations reached 603,307 in 2025, with over 5 million robots in operation. The IFR forecasts 655,000 installations in 2026. MES, AI inspection and digital twins deliver value when tied to specific problems.
- Workforce skills constrain production. US manufacturers may need 3.8 million additional workers between 2024 and 2033, with 1.9 million roles potentially unfilled. Training and standard work are as important as equipment.
- Verify improvements across the line. Establish baseline metrics, fix the bottleneck, check whether the constraint shifts, and standardize successful changes.
Manufacturing operations are the activities that convert raw materials and components into finished goods using equipment, labor, technology, and production systems.
Production operations cover a broader set of activities used to create output, including planning, scheduling, resource allocation, processing, quality control, and output management.
Manufacturing is one type of production focused on physical products, while production operations can also apply to other goods and services. Process optimization is the systematic improvement of workflows, resource utilization, cycle time, quality, and production costs.
This guide explains how manufacturing operations work, the main production methods and performance metrics, and the production optimization techniques businesses use to improve efficiency, quality, and cost.
How do Manufacturing and Production Operations Work?
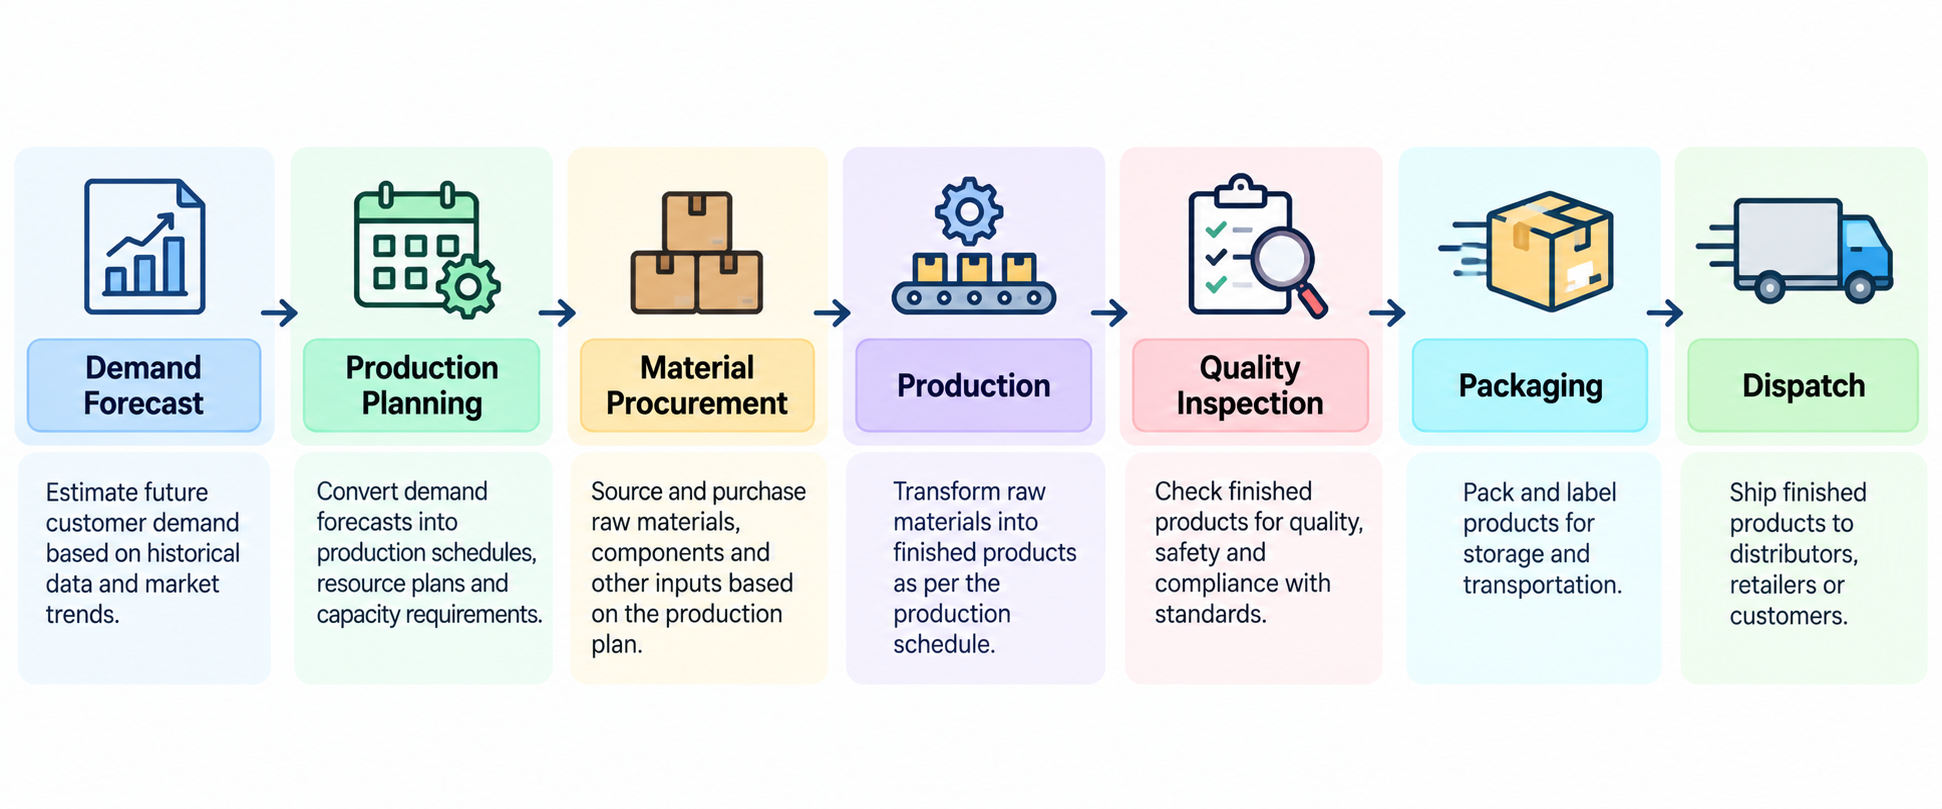
Manufacturing and production operations turn customer demand into finished products through a coordinated sequence of planning, material preparation, processing, quality checks, and delivery. The exact workflow depends on the product, production method, and industry, but most operations follow the same core stages.
Plan Production Requirements
Planning sets the foundation for every later stage. Teams translate forecasts and confirmed orders into output targets, then check that people, machines, and materials can support the plan before work begins. The main planning tasks are:
- Estimate customer demand and the output required to meet it.
- Set production targets and schedules by product and period.
- Determine labor, equipment, and material requirements.
- Align production capacity with delivery commitments.
Procure and Prepare Materials
Production can only run as fast as materials reach the line. This stage makes sure the right raw materials and components are available in the right quality and quantity when each operation needs them. Material readiness involves:
- Sourcing raw materials and components against the production plan.
- Verifying availability and incoming quality before release to the floor.
- Scheduling material movement to workstations in production sequence.
- Preventing shortages without building unnecessary work-in-progress inventory.
Execute the Manufacturing Process
This is where the physical transformation happens. Machines, operators, and workstations convert materials into components or finished products, while supervisors watch output and process conditions to keep each run on target. Execution typically includes:
- Setting up machines and workstations for the scheduled product.
- Assigning tasks to operators and production equipment.
- Converting raw materials through machining, forming, assembly, or processing.
- Monitoring output, cycle time, and conditions such as speed, temperature, or pressure.
Inspect Product Quality
Quality checks run during production, not only at the end. Catching a deviation early limits scrap and rework, while final inspection confirms that each product meets its specifications before it leaves the facility. Effective inspection covers:
- In-process checks at critical operations.
- Identification of defects and deviations from specification.
- Correction of root causes, such as machine settings or tooling, before production continues.
- Verification of finished products against specifications.
Package and Dispatch Finished Goods
The final stage moves completed products out of production and toward the customer. Accurate packaging, labeling, and inventory records keep fulfilment on schedule and show planners what has actually been completed. This stage includes:
- Packaging and labeling products to customer and regulatory requirements.
- Updating finished-goods inventory.
- Coordinating the handoff to warehousing and transportation.
- Tracking order fulfilment against delivery schedules.
Key point: Effective production operations connect planning, materials, people, equipment, and quality control so that products are made to specification and delivered on time.
What are the Main Types of Manufacturing and Production Processes?
Manufacturers select production methods based on product variety, demand volume, customization requirements, and how standardized the process can be. Each method balances flexibility against cost per unit in a different way, so the right choice depends on what the business sells and how it sells it.
Job Production
Job production makes one-off or highly customized products, usually to a customer’s exact specification. It relies on flexible, general-purpose equipment and skilled workers who can adapt to each order. Its main characteristics are:
- Typical outputs include custom furniture and made-to-order machinery.
- Customization is high, and each order is planned individually.
- The trade-off is higher cost per unit, longer lead times, and less repeatable processes.
Batch Production
Batch production makes goods in defined groups, then switches the same equipment to another product or variant. It suits manufacturers that offer several products with moderate, repeat demand. Key considerations include:
- Common examples are bakery products, pharmaceuticals, and specialty chemicals.
- Reusing equipment across products improves asset utilization.
- Every switch requires setup or cleaning time that produces no output.
- Batch size balances setup cost against inventory: larger batches spread setup time but raise stock levels and lead time.
Mass Production
Mass production makes large quantities of standardized products on assembly lines with repeatable workflows. High volume lowers cost per unit, but the line performs well only when every station works at a consistent pace and quality level. Important factors are:
- Typical products include consumer electronics, automobiles, and household appliances.
- Consistent quality is essential because one process fault can repeat across thousands of units.
- Line balancing keeps workloads even so that no single station holds back output.
Continuous Production
Continuous production runs materials through a continuous or near-continuous process, often for long periods without stopping. It uses specialized, high-capacity equipment designed for one type of output. Its defining features are:
- Typical industries include oil refining, cement, paper, and chemical processing.
- Shutdowns and restarts are expensive, so unplanned downtime causes major losses.
- Process stability is critical because changes in temperature, pressure, or feed quality affect the entire output stream.
How to Choose the Right Production Method?
No single method suits every product. The right choice comes from matching the method to the product, the market, and the available resources, and these factors should be weighed together rather than one at a time:
- Product complexity and customization: high variety favors job or batch production.
- Demand volume and predictability: stable, high volume supports mass or continuous production.
- Equipment and labor requirements: dedicated lines need capital, while flexible cells need skilled labor.
- Setup costs and changeover time: long changeovers push toward larger batches or dedicated lines.
- Quality and delivery requirements: tight specifications and short lead times favor stable, standardized processes.
What is the Difference Between Manufacturing Operations and Production Operations?
Manufacturing operations focus on producing physical goods, while production operations cover the broader activities involved in creating goods or delivering outputs. In many industrial settings the terms overlap, but separating them helps clarify responsibilities and how performance is measured.
Manufacturing Operations vs Production Operations
The clearest way to separate the two is to compare their scope, activities, resources, environment, objective, and a typical example. The table below sets these differences side by side.
| Area | Manufacturing Operations | Production Operations |
|---|---|---|
| Scope | Focuses on converting materials into physical goods | Broader focus on creating goods and managing output |
| Activities | Machining, assembly, fabrication, finishing | Planning, scheduling, processing, and output control |
| Resources | Machines, materials, production workers | People, processes, equipment, and other resources |
| Typical environment | Factories and manufacturing facilities | Factories and other production environments |
| Main objective | Produce goods to required specifications | Deliver the required output efficiently and consistently |
| Example | Assembling a car | Planning and managing the full production schedule |
How Manufacturing and Production Operations Work Together?
In practice, the two functions form one system. Production operations decide what should happen and when, manufacturing makes it happen on the shop floor, and feedback from the floor shapes the next plan. Each function contributes in a specific way:
- Production planning determines output targets and schedules.
- Manufacturing executes physical transformation and assembly.
- Quality control verifies that products meet specification.
- Operations management coordinates resources and tracks performance.
- Continuous improvement addresses bottlenecks and waste.
Key point: Manufacturing operations are a core part of production operations, and both depend on effective planning, execution, and performance monitoring.
What is Production Planning and Control?
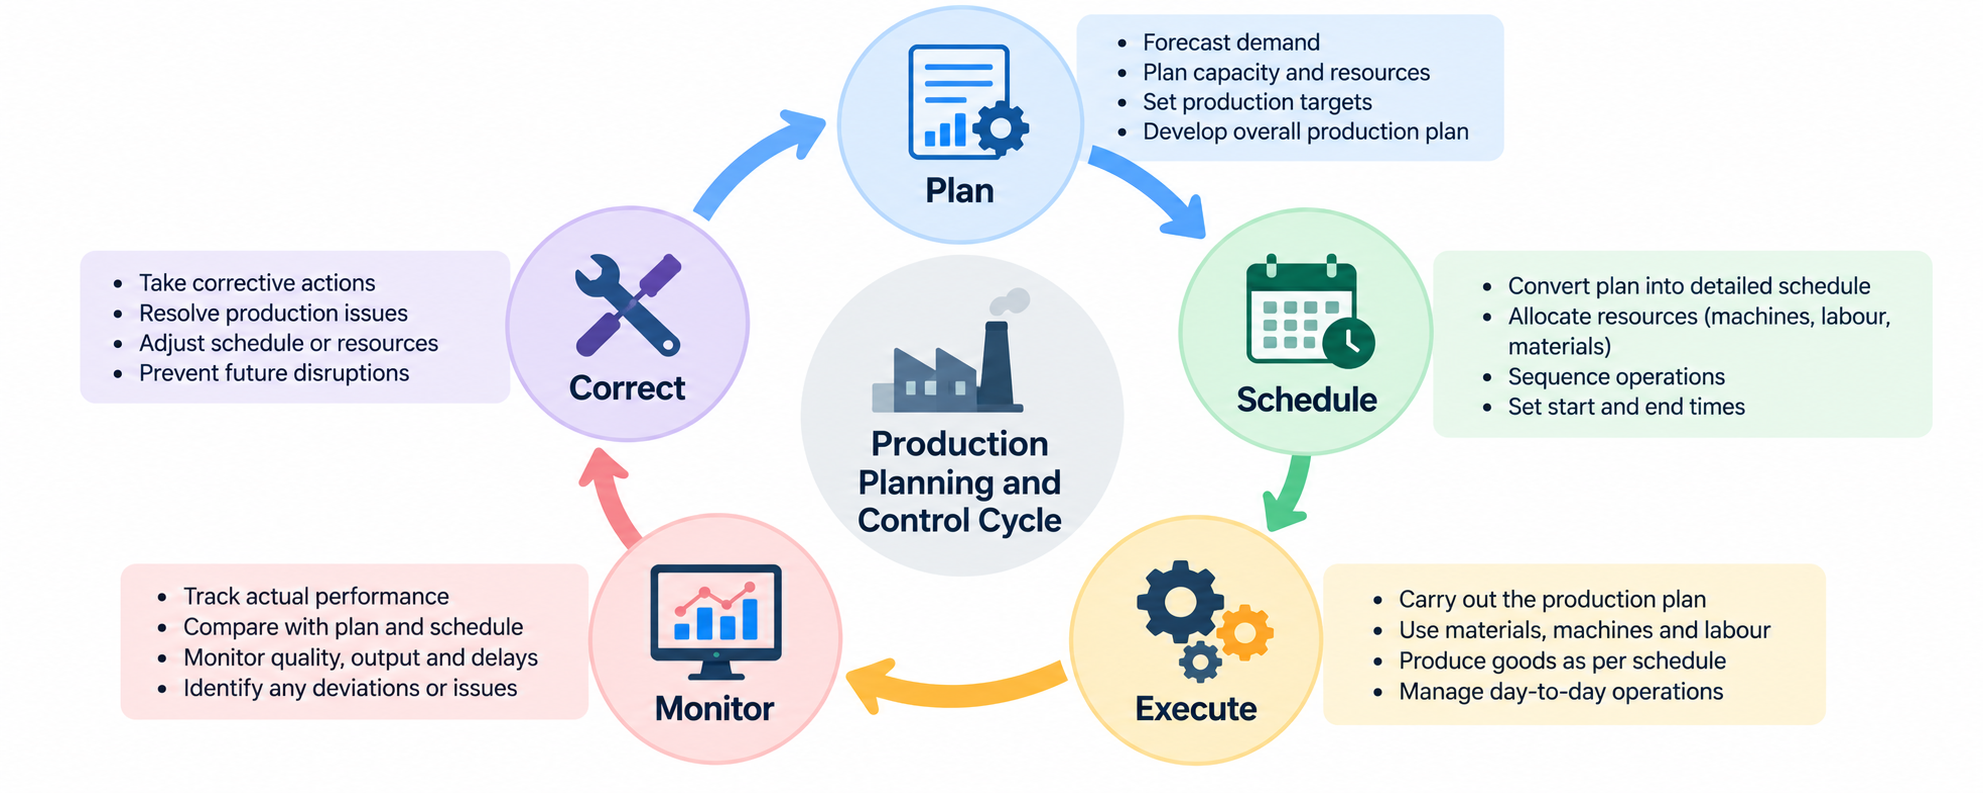
Production planning and control (PPC) determines what to produce, how much to produce, when to produce it, and how to monitor progress against the plan. It sits at the center of manufacturing operations management because it links demand, capacity, and day-to-day execution.
Production Planning
Planning converts demand into a feasible production plan. Its purpose is to confirm that materials, capacity, and people will be ready before output targets are committed to customers. Core planning activities are:
- Estimating demand and production requirements.
- Checking material and capacity availability.
- Setting production targets by product and period.
- Coordinating procurement and workforce requirements.
Production Scheduling
Scheduling turns the plan into a sequence of jobs on specific machines, lines, and shifts. A realistic schedule balances workloads and reserves time for maintenance and changeovers instead of assuming equipment is always available. Scheduling involves:
- Assigning jobs to machines, lines, and workers.
- Setting production sequences and start times.
- Balancing workloads across workstations.
- Accounting for planned maintenance and changeovers.
Production Control
Control compares what is happening on the floor with what was planned. When output falls behind, control finds the cause and adjusts the schedule before small delays turn into missed deliveries. Typical control tasks are:
- Monitoring actual output against planned output.
- Identifying delays and deviations early.
- Resolving material, equipment, and labor constraints.
- Updating schedules when conditions change.
Capacity Planning and Resource Allocation
Capacity planning checks whether the facility can actually produce the planned volume. It shows where resources are overloaded or underused, so managers can rebalance work or add capacity only where it is needed. This work includes:
- Evaluating machine and labor capacity.
- Identifying bottlenecks and underused resources.
- Matching production volume to available capacity.
- Planning additional shifts or equipment where necessary.
These four activities repeat as a continuous cycle rather than a one-time exercise.
What are the Key Metrics for Measuring Manufacturing Performance?
Manufacturing performance metrics help teams determine whether production operations are meeting targets for output, quality, speed, cost, and equipment reliability. Tracking several metrics together prevents a team from improving manufacturing efficiency in one area while creating losses in another.
Overall Equipment Effectiveness (OEE)
OEE measures how effectively equipment is used compared with its full potential. It is calculated as Availability × Performance × Quality, where each factor captures a different type of loss:
- Availability: time lost to breakdowns, setups, and changeovers.
- Performance: speed lost to slow cycles and minor stops.
- Quality: output lost to scrap and rework.
Because each loss is visible separately, OEE shows whether equipment improvement should focus on maintenance, process speed, or quality.
Cycle Time and Throughput
These two metrics describe production speed from different angles. Cycle time looks at a single process or unit, while throughput looks at total output over a period.
- Cycle time: the time required to complete a production cycle or unit, depending on how the measurement is defined.
- Throughput: the number of units produced over a defined period.
Reducing cycle time can increase throughput when other constraints, such as material supply and staffing, remain under control. Shortening cycle time at a non-bottleneck station rarely raises overall output.
First-Pass Yield and Defect Rate
First-pass yield (FPY) is the proportion of units that pass quality checks the first time, without rework. Defect rate tracks the proportion that fail. Together, they show how consistent the manufacturing process is:
- FPY equals units passing first time divided by units entering the process.
- Tracking defects by type, station, and shift reveals recurring quality issues.
- Trends in both metrics point to opportunities to improve process consistency.
Production Cost per Unit
Cost per unit shows what it actually costs to make each product. It is one of the clearest ways to judge whether an improvement project created financial value. To use it well:
- Include relevant material, labor, energy, and overhead costs.
- Divide total production cost by the number of good units produced.
- Compare results before and after process improvements.
On-Time Delivery and Schedule Adherence
On-time delivery measures whether orders reach customers when promised. Schedule adherence measures whether production follows its own plan, and a gap in adherence usually shows up later as a delivery problem. These metrics help teams:
- Measure whether orders are completed and delivered as planned.
- Track deviations from production schedules by line or product.
- Connect schedule performance with customer commitments.
Work-in-Progress (WIP) Inventory
WIP is the stock of partially completed goods between operations. Some WIP keeps stations supplied, but too much hides problems and slows the flow of orders through the plant. Monitoring WIP helps teams:
- Track partially completed goods at each stage.
- Spot excess WIP that signals a bottleneck downstream.
- Protect lead time, since average lead time equals WIP divided by throughput (Little’s Law), so higher WIP means longer lead times and reduced visibility.
What are the Most Effective Manufacturing Process Optimization Techniques?
Manufacturing process optimization improves how work flows through production by reducing waste, eliminating bottlenecks, improving quality, and using resources more effectively. The techniques below complement each other, and most effective production process optimization programs combine several of them.
Lean Manufacturing
Lean manufacturing focuses on removing activities that do not add value from the customer’s point of view. It shortens lead times and frees capacity without necessarily adding equipment. Core lean practices include:
- Identifying and eliminating activities that do not add customer value.
- Reducing waiting, excess movement, overproduction, and unnecessary inventory.
- Using value stream mapping to visualize material and information flow.
Six Sigma and Statistical Process Control
Six Sigma reduces defects by finding and controlling sources of variation. Statistical process control (SPC) supports it by charting process data over time, so teams can see a process drifting before it produces defects. The approach relies on:
- Using data to identify sources of variation.
- Applying DMAIC: Define, Measure, Analyze, Improve, Control.
- Monitoring process stability with control charts to reduce defects.
Theory of Constraints
The Theory of Constraints holds that every system has at least one step that limits total output. Improving that constraint raises output for the whole operation, while improving other steps often does not. The method works in a repeating sequence:
- Identify the process step limiting overall output.
- Prioritize improvements at the bottleneck.
- Align other production activities with the pace of the constrained resource.
- Reassess the system when the constraint changes.
Line Balancing
Line balancing distributes tasks across workstations so each has a similar workload relative to its capacity and the required pace of demand, known as takt time. A balanced line reduces idle time at fast stations and queues at slow ones. It involves:
- Distributing work across stations according to their capacity.
- Reducing idle time and uneven workloads.
- Identifying stations that restrict production flow.
Setup Time and Changeover Reduction
Changeover time runs from the last good unit of one production run to the first good unit of the next. Reducing it adds productive time and makes frequent product switches affordable. Common practices include:
- Standardizing preparation, tools, and machine settings.
- Applying SMED (Single-Minute Exchange of Die) principles where appropriate, moving setup tasks off-line so they happen while the machine is still running.
- Using shorter changeovers to support smaller batches, lower inventory, and greater flexibility.
Preventive and Predictive Maintenance
Maintenance strategy directly affects equipment availability and product quality. Preventive maintenance follows a time- or cycle-based schedule, while predictive maintenance uses condition data to intervene before a failure occurs. A strong program will:
- Schedule maintenance to reduce unexpected equipment failures.
- Monitor equipment condition and performance, such as vibration and temperature.
- Use sensor data to identify potential failures before they disrupt production.
The payoff can be significant. In NIST research, among plants that already relied mainly on planned maintenance, those making the most use of predictive maintenance saw 15% less downtime and an 87% lower defect rate.
Key point: Optimization should target the cause of poor performance, not just increase machine speed. Improving one step without considering the full production system may shift the bottleneck elsewhere.
How does Automation and AI Improve Manufacturing Operations?
Automation and AI help manufacturers improve consistency, visibility, planning, and decision-making. Their value depends on the production environment, data quality, system integration, and the specific operational problem being addressed.
Industrial Automation and Robotics
Automation handles tasks that are repetitive, physically demanding, or precision-sensitive. Adoption continues to grow: the worldwide stock of operational industrial robots passed 5 million units in 2025. Typical benefits include:
- Automating repetitive or precision-sensitive tasks.
- Improving consistency and reducing manual handling.
- Supporting assembly, welding, packaging, and material movement.
Manufacturing Execution Systems (MES)
A Manufacturing Execution System (MES) is software that tracks and manages production activity on the shop floor. It bridges the gap between business planning systems and the machines and people doing the work. An MES is used to:
- Track production activity on the shop floor.
- Monitor work orders, output, and quality.
- Connect production execution with planning systems such as ERP.
AI-Based Quality Inspection
AI-based inspection uses computer vision models trained on images of acceptable and defective parts. It can inspect units at line speed and flag patterns that manual checks may miss. Its main uses are:
- Detecting defects using cameras and computer vision.
- Identifying patterns in recurring quality issues.
- Supporting faster and more consistent inspection.
Predictive Maintenance Using AI
AI extends predictive maintenance by analyzing large volumes of sensor and maintenance data. Models learn how equipment behaves under normal conditions and flag deviations that may signal an emerging fault. In practice, AI can:
- Analyze sensor readings and equipment history.
- Identify abnormal operating conditions.
- Help maintenance teams prioritize interventions.
AI for Production Scheduling and Forecasting
Scheduling and forecasting involve many interacting variables. AI and optimization tools can evaluate far more combinations than a planner working by hand, which is most useful when resources are limited. These tools help to:
- Improve demand and capacity forecasts.
- Evaluate scheduling alternatives quickly.
- Support decisions when machines, materials, or labor are constrained.
Digital Twins and Real-Time Production Monitoring
A digital twin is a virtual model of a machine, line, or process that is updated with real operating data. Combined with real-time monitoring, it lets teams test changes safely and see losses as they happen. Digital twins are used to:
- Create virtual representations of equipment or production processes.
- Simulate changes before applying them on the floor.
- Compare actual performance with expected performance.
What are the Common Challenges in Manufacturing and Production Operations?
Manufacturing operations face challenges that can disrupt output, increase costs, and affect product quality. Optimization requires identifying the underlying causes rather than treating every issue as an isolated incident.
Equipment Downtime
Downtime removes productive capacity and disrupts schedules for downstream operations. NIST found that plants relying most heavily on reactive maintenance had 3.3 times more downtime than those relying on it least. Most downtime traces back to:
- Unexpected machine failures.
- Poor maintenance planning.
- Spare-parts shortages that extend repair times.
Production Bottlenecks
A bottleneck is any step whose capacity is lower than the demand placed on it. Output for the whole line falls to the pace of that step, and WIP builds up in front of it. Common causes include:
- Uneven workstation capacity.
- Long changeovers.
- Excessive waiting between operations.
Material Shortages and Supply Delays
Even well-run lines stop when materials are missing. From a production standpoint, shortages usually stem from planning and visibility gaps rather than a single late delivery. The usual sources are:
- Unreliable supplier lead times.
- Inaccurate material planning.
- Weak inventory visibility.
Quality Issues and Rework
Quality problems consume capacity twice: once to make the defective unit and again to rework or replace it. They also disrupt schedules and raise cost per unit. Frequent causes are:
- Process variation.
- Incorrect machine settings.
- Inconsistent operating procedures.
Labor and Skills Constraints
Production depends on trained operators, technicians, and engineers. The Manufacturing Institute projects that up to 1.9 million US manufacturing jobs could go unfilled through 2033 if workforce challenges are not addressed. On the shop floor, this appears as:
- Shortage of trained operators.
- Uneven workload distribution.
- Insufficient training and documentation.
Balancing Efficiency with Flexibility
Highly efficient operations favor long runs and steady schedules, while customers increasingly expect variety and fast response. Managing this tension is an ongoing strategic choice, shaped by:
- Changing customer demand.
- Product customization.
- Frequent production schedule changes.
- Trade-offs between utilization, inventory, and responsiveness.
Manufacturing Operations Example: Optimizing an Assembly Line
An assembly line example shows how a manufacturer can use production data and process improvement methods to increase output without automatically investing in additional equipment. The hypothetical scenario below follows five steps from problem to verified result.
Step 1 : Identify the Production Problem
Consider a manufacturer of small household appliances whose final assembly line regularly falls short of its daily plan. Supervisors notice three symptoms that point to a flow problem rather than a general lack of capacity:
- Production targets are consistently missed.
- Work-in-progress accumulates before one workstation.
- Operators at other stations experience idle time.
Step 2 : Measure the Current Process
Before changing anything, the team builds a baseline. Measuring each station across several shifts separates real patterns from one-off events and gives a reference point for judging results. The team records:
- Cycle time at each station.
- Downtime and changeovers.
- Defects, throughput, and WIP.
Step 3 : Identify the Bottleneck
The baseline data shows one station with a cycle time longer than the line’s takt time, in the same place where WIP builds up. The team then investigates why that station is slow:
- Compare station capacity with required output.
- Investigate recurring delays at the station.
- Determine whether the constraint comes from equipment, method, materials, or labor.
Step 4 : Apply Targeted Improvements
In this example, the constraint comes from the work method rather than machine speed. The fixes therefore focus on how work is distributed and performed instead of on buying new equipment:
- Balance workloads by moving tasks to stations with spare capacity.
- Standardize work procedures.
- Reduce unnecessary movements and changeovers.
- Improve material availability at the point of use.
Step 5 : Monitor Results
Results are judged against the baseline and across the whole line. Relieving one bottleneck can expose the next-slowest station, so the team confirms the constraint has not simply moved before locking in the changes:
- Compare throughput before and after changes.
- Track quality and defect rates.
- Verify that the bottleneck has not shifted.
- Standardize successful improvements.
Key point: A successful optimization project uses measurable baseline data and checks whether improvements benefit the entire production flow, not just one workstation.
Transform Manufacturing Operations with AI
Discover how AI can optimize production workflows, improve operational decision-making, and enhance process efficiency with the Certificate Programme in AI-Powered Operations & Process Transformation by IIM Tiruchirappalli.
Frequently Asked Questions About Manufacturing and Production Operations
How can manufacturers reduce production costs without compromising product quality?
Target waste rather than cutting inputs. Reducing scrap, rework, downtime, excess inventory, and unnecessary movement lowers cost while protecting quality. Track first-pass yield alongside cost per unit so that any saving that increases defects shows up immediately.
What is the difference between production efficiency and manufacturing productivity?
Production efficiency compares actual performance with a standard or potential, such as actual output against maximum possible output, and is usually shown as a percentage. Productivity is a ratio of output to input, such as units per labor hour. A plant can meet its standards and still be less productive than competitors with better processes.
How can manufacturers determine the ideal production batch size?
The ideal batch size balances setup cost against inventory holding cost. Economic batch quantity models give a starting point, but bottleneck capacity, demand variability, shelf life, and storage limits should shape the final decision. Reducing changeover time lowers the ideal batch size.
What causes production delays even when machines are operating efficiently?
Delays often come from outside the machine: material shortages, waiting between operations, poor scheduling, slow changeovers, quality holds, or labor gaps. High efficiency at a non-bottleneck machine can even add to delays by building WIP that blocks flow. Measure total lead time, not just machine efficiency.
How can manufacturers reduce scrap rates and material waste?
Start by measuring scrap by product, station, and cause, then address the largest causes first. Standardized machine settings, SPC to catch drift early, error-proofing, operator training, and careful material handling all reduce scrap. Better cutting layouts and recovery of reusable material reduce raw material waste.
How do manufacturers decide whether to outsource production or manufacture in-house?
Compare the total cost of each option, including quality, lead time, logistics, and management effort, not just unit price. Also consider whether the process is a core capability, whether internal capacity is available, how much control over quality and intellectual property is needed, and the level of supplier risk.
What is the difference between production capacity and actual production output?
Capacity is the maximum output a facility can achieve under normal operating conditions. Actual output is what it produces after downtime, slowdowns, defects, and demand limits. The gap is normal: US manufacturing used 75.7% of its capacity in August 2026, under its long-run average of 78.2%.
How can manufacturers improve production flexibility when customer demand changes?
Shorten changeovers so smaller batches become affordable, and cross-train operators so labor can move between lines. Flexible equipment or modular work cells, shorter planning cycles, and strategic buffers of critical components also help production respond faster without large efficiency losses.
How can real-time production data help prevent manufacturing delays?
Real-time data shows problems while they are happening rather than at the end of a shift. Alerts on downtime, slow cycles, quality drift, or material shortages let supervisors act within minutes. Over time, the same data reveals recurring patterns that planners can address in schedules and maintenance plans.
What factors should manufacturers consider before investing in production automation?
Start with the problem automation should solve, and confirm the process is stable and standardized, because automating a poor process locks in its waste. Then assess volume and product mix, total cost of ownership, integration with existing systems, required skills, safety, and expected payback.
How can manufacturers reduce changeover time when switching between products?
Use SMED: record the current changeover, separate tasks that require the machine to stop from those that do not, and move as many as possible to before or after the stop. Then standardize tools and settings, prepare materials in advance, and document the best method for every crew.
How can manufacturers calculate the payback period of a process optimization project?
Divide the total upfront investment by the expected annual net savings: Payback period = Initial investment ÷ Annual net savings. For example, a hypothetical project costing $100,000 that saves $40,000 a year pays back in 2.5 years. Include training and downtime costs, and base savings on measured baseline data.