
Cohort Analysis in Marketing: How to Read Retention Curves


Key Insights
- Look beyond overall retention: Cohort analysis reveals differences in how user groups behave over time.
- Compare cohorts at the same stage: Comparing Week 4 with Week 4 gives a more meaningful view of retention changes.
- Use retention curves to spot drop-offs: Sharp declines and flattening curves help identify patterns worth investigating.
- Track acquisition and behaviour: Acquisition cohorts show retention trends, while behavioural cohorts reveal actions associated with stronger retention.
- Treat patterns as hypotheses: Better retention in a newer cohort signals a potential improvement, but does not prove its cause.
- Turn insights into action: Investigate patterns, test possible explanations, implement changes, and measure the results.
- Keep measurement consistent: Use the same retention definition and calculation method across cohorts to avoid misleading comparisons.
Overall retention tells you how many users stay. It does not always tell you which users stay, when they leave, or whether newer users behave differently from older ones.
Cohort analysis solves this by grouping users who share a starting point or behaviour and tracking what happens to them over time. This makes differences between user groups easier to spot.
This guide covers cohort analysis types, cohort retention tables, retention curves, GA4 and spreadsheet workflows, and how to turn the patterns you find into practical marketing and product actions. Pasted markdown
What are the Main Types of Cohort Analysis in Marketing?
Cohort analysis types are mainly divided into acquisition cohorts and behavioural cohorts. Acquisition cohorts group users by when they joined, while behavioural cohorts group them by what they did.
Acquisition Cohorts
An acquisition cohort groups users according to when they entered the customer journey.
Examples include:
- Signup week
- First-purchase month
- Acquisition date
- Campaign period
The main question is:
Are newer cohorts retaining better or worse than earlier cohorts?
For example, comparing January, February and March signup cohorts can show whether retention is improving, declining or staying relatively stable.
Behavioural Cohorts
A behavioural cohort groups users according to an action they performed.
Examples include users who:
- Completed onboarding
- Used a particular feature
- Made a second purchase
- Completed a conversion event
The question becomes:
Do users who perform a particular behaviour show different subsequent retention?
| Cohort type | Grouped by | Main question |
|---|---|---|
| Acquisition | When users joined or purchased | Is retention changing over time? |
| Behavioural | What users did | Which behaviours are associated with retention? |
Cohort analysis is one part of a broader marketing analytics workflow, alongside customer research, performance measurement and growth strategy. These skills can be developed together through the IIM Tiruchirappalli AI-Powered Marketing & Growth Strategy programme.
How Do You Read a Cohort Retention Table and Curve?
Read across a row to follow one cohort over time and down a column to compare different cohorts at the same stage. This is the key to reading a cohort analysis table correctly.
How Is a Cohort Analysis Table Structured?
A basic cohort analysis table contains:
- Rows: Individual cohorts
- Columns: Time periods since the cohort started
- Cells: Percentage or number of users who meet the defined return condition
For example:
| Cohort | Week 1 | Week 2 | Week 3 |
|---|---|---|---|
| January | 48% | 35% | 29% |
| February | 53% | 41% | 34% |
| March | 59% | 46% | 39% |
Illustrative data.
The important detail is that Week 2 means the second period of the cohort’s life, not necessarily the second calendar week of the year.
How Do You Read Across a Row?
Read across a row when you want to see how one cohort behaves as it ages.
For March: 59% → 46% → 39%
This shows retention declining as the cohort moves from Week 1 to Week 3.
Look for:
- Where the biggest drop occurs
- Whether the decline slows down
- Whether retention eventually begins to flatten
How Do You Read Down a Column?
Read down a column when you want to compare cohorts at the same age.
For Week 2:
- January: 35%
- February: 41%
- March: 46%
March is retaining more users than the earlier cohorts at the same stage.
This is more meaningful than comparing March Week 1 with January Week 3 because those cohorts have had different amounts of time to mature.
How Does a Cohort Table Become a Retention Curve?
A retention curve plots the cohort’s retention percentage against time.
Common patterns include:
| Pattern | What it may indicate |
|---|---|
| Sharp early decline | Significant early drop-off |
| Gradual decline | Users are leaving more slowly |
| Curve flattening | A more stable group remains |
| Higher newer-cohort curve | Possible improvement |
| Lower newer-cohort curve | Possible deterioration |
A curve should not automatically be labelled “good” or “bad”. The expected shape depends on the product, retention definition and customer lifecycle.

Alt text: Cohort retention curves showing early drop-off, gradual decline and retention flattening across user cohorts
Cohort Analysis Examples: What Does the Pattern Tell You?
A cohort analysis example can show whether newer groups are retaining users better than earlier groups.
Consider these retention rates:
January: 48% → 35% → 29%
February: 53% → 41% → 34%
March: 59% → 46% → 39%
The March cohort performs better at each equivalent period. That gives the analyst a useful lead:
- March retention is higher.
- Something may have changed between the cohorts.
- Investigate acquisition mix, onboarding, product experience and campaigns.
- Test the strongest explanation.
The cohort pattern does not prove causation. It tells you where to investigate.
How Do You Do Cohort Analysis in Google Analytics 4?
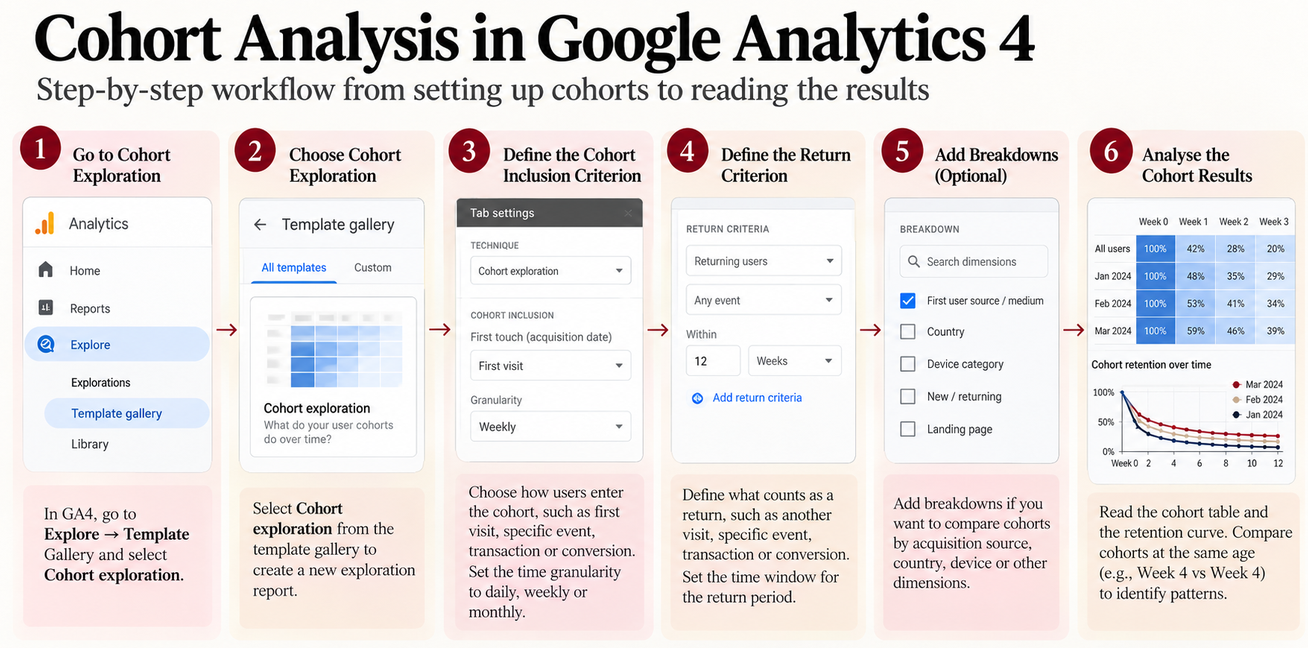
GA4’s Cohort exploration lets you define how users enter a cohort, what counts as a return and how the groups should be compared over time.
Open Cohort Exploration
In GA4, go to: Explore → Template Gallery → Cohort exploration
Google’s documentation describes Cohort exploration as a way to define cohort inclusion and return criteria and analyse user behaviour over subsequent periods.
Define the Cohort Inclusion Criterion
The inclusion criterion determines who enters the cohort. Depending on your analysis, this could be:
- First visit
- An event
- A transaction
- A conversion
- A specific event
GA4 supports daily, weekly and monthly cohort granularity.
Define the Return Criterion
Next, decide what qualifies as a return. For example:
- Another visit or event
- Another transaction
- Another conversion
- A specific event
Choose the return condition based on the question you are trying to answer.
For a repeat-purchase analysis, for example, a transaction is more useful than simply counting any event.
Analyse the Output
Once the criteria and time granularity are set, read the output using the same logic:
Across a row = one cohort over time
Down a column = different cohorts at the same age
GA4 also supports different cohort calculation types and breakdowns, which can help you examine the same cohorts from different angles.
How Do You Do Cohort Analysis in a Spreadsheet?
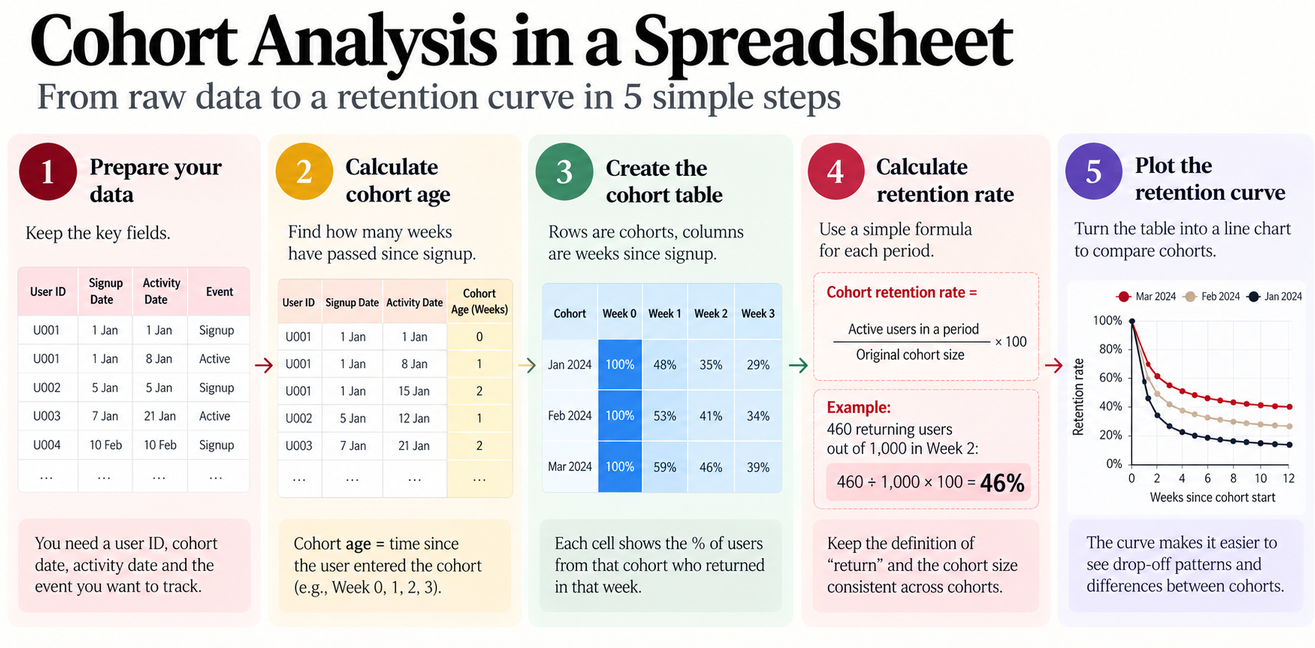
A spreadsheet can handle cohort analysis when the raw activity data is structured consistently.
Organise the Raw Data
Start with fields such as:
- User or customer ID
- Cohort date
- Activity date
- Activity or return event
The exact fields depend on the metric you want to analyse.
Calculate Cohort Age
Cohort age tells you how much time has passed since a user entered the cohort.
For a weekly analysis:
- Week 0 = starting week
- Week 1 = one week later
- Week 2 = two weeks later
- Week 3 = three weeks later
This allows users acquired in different calendar periods to be compared fairly.
Build the Cohort Table
Place: Rows → Cohorts
Columns → Periods since cohort start
Then calculate how many users meet the defined return condition in each cell.
Calculate Cohort Retention Rate
Use: Cohort retention rate = active users in a period ÷ original cohort size × 100
For example: 460 returning users ÷ 1,000 original users × 100 = 46%
Keep the definition of active and the denominator consistent across cohorts. Otherwise, the comparison may become misleading.
Plot the Retention Curve
Turn the retention percentages into a line chart. This makes it easier to compare:
- Early drop-off
- Later retention
- Curve flattening
- Newer versus older cohorts
What Insights Can Cohort Analysis Reveal?
The value of cohort analysis comes from turning a pattern in the data into a question that can be investigated and tested.
Are Newer Cohorts Retaining Better?
Compare newer and older cohorts at the same age. If March Week 4 retention is consistently higher than January Week 4 retention, investigate what changed between those cohorts.
Potential areas include:
- Acquisition sources
- Campaigns
- Onboarding
- Product changes
- Customer mix
Where Does the Biggest Drop-Off Occur?
Find the point where the retention curve falls most sharply. That period becomes an investigation point.
For example, if the largest decline occurs between Week 1 and Week 2, examine what users experience during that part of the journey.
Which Behaviours Are Associated With Better Retention?
Behavioral cohorts can compare users who completed an important action with those who did not. For example:
Completed onboarding → retention
Did not complete onboarding → retention
If the difference is meaningful, the behaviour can become a hypothesis for further testing.
Which Acquisition Sources Produce More Retained Users?
Where the data supports it, compare cohorts by acquisition source or campaign. Two channels may produce similar numbers of new users but very different retention outcomes. This helps marketers look beyond acquisition volume and ask: Which sources bring users who continue to engage?
What Should You Do With the Insight?
Use this workflow:
Cohort pattern → Hypothesis → Investigation → Action → Measurement
Possible actions include:
- Improve onboarding
- Change lifecycle messaging
- Adjust acquisition targeting
- Investigate product friction
- Test activation interventions
The analysis identifies a pattern. Your next step is to investigate whether the suspected factor actually explains it.
Conclusion (H2)
Cohort analysis makes retention data easier to act on because it shows how different groups behave over time, rather than hiding everything inside one average.
The most useful habit is to compare cohorts at the same stage, identify where behaviour changes and treat the pattern as a starting point for investigation.
Build deeper marketing analytics, AI and growth strategy skills with the IIM Tiruchirappalli Certificate Programme in AI-Powered Marketing & Growth Strategy.
Frequently Asked Questions (H2)
What is a good cohort size for analysis?
There is no universal minimum cohort size. The cohort should be large enough to produce a meaningful comparison without being so broad that important differences between user groups disappear. For smaller cohorts, treat percentage changes cautiously because a few users can move the rate substantially.
How long should you track a cohort?
The tracking period should match the product’s customer lifecycle and the question being investigated. A subscription product may require monthly or longer-term retention, while a frequently used app may reveal meaningful patterns within days or weeks.
Why can retention increase after dropping?
A retention curve can flatten or even rise when users return after an initial drop-off, particularly when the measured behaviour is intermittent rather than continuous. The pattern should be interpreted according to what “retained” actually means in the analysis.
Why should cohort retention be compared at the same age?
Different cohorts have had different amounts of time to mature. Comparing January Week 4 with March Week 1 mixes different stages of the customer journey. Comparing both at Week 4 provides a more meaningful basis for judging whether cohort performance has changed.
What can cause a newer cohort to have better retention?
Possible factors include changes in acquisition channels, customer mix, onboarding, product experience, pricing, campaigns or lifecycle messaging. A stronger cohort is a signal to investigate these factors, not evidence that one of them caused the improvement.
How can cohort analysis help identify a weak marketing channel?
Compare users acquired through different channels or campaigns at equivalent cohort ages. A channel that generates many new users but consistently produces weaker retention may be less valuable than one with lower acquisition volume and stronger downstream behaviour.
Can cohort analysis distinguish acquisition problems from product problems?
It can help narrow down the investigation, but it cannot establish the cause by itself. If multiple acquisition cohorts deteriorate after a product change, for example, that creates a useful hypothesis to investigate alongside product and behavioural data.
What is the difference between retention and cohort retention?
Overall retention combines users across different acquisition periods. Cohort retention keeps those groups separate, allowing you to see whether retention changes for users who entered at different points in time.
Can cohort analysis be used for revenue and LTV?
Yes. Instead of measuring whether users return, cohorts can be compared on revenue generated, repeat purchases or customer lifetime value. This can reveal differences in the quality of customers acquired during different periods.
When should you use behavioural cohorts instead of acquisition cohorts?
Use behavioural cohorts when the question concerns what users do, rather than when they arrived. For example, if you want to know whether completing onboarding is associated with stronger retention, grouping users by onboarding behaviour is more useful than grouping them only by signup month.
What should you investigate when a retention curve drops sharply?
Start by identifying when the drop occurs and what users experience during that period. Then examine onboarding, activation, product friction, messaging, acquisition quality or other relevant changes around that stage. The curve tells you where to look, not necessarily why the drop happened.
What are common mistakes in cohort analysis?
Common mistakes include comparing cohorts at different ages, changing the definition of retention between cohorts, using very small cohorts without considering statistical noise, treating correlation as causation, and focusing on percentages without checking the underlying user counts.