Download PDF


Introduction
If you are managing data, Microsoft Excel is your go-to application. Spreadsheets in Excel have been in use for around more than 30 years. Excel has a better user interface and numerous contemporary features than its original edition. All major operating systems, including Windows, macOS, iOS, and Android, are compatible with Excel. Some of the key features of Microsoft Excel include:
- Graphing software
- Integrated capabilities (SUM, DATE, COUNTIF)
- Tables, charts, and filters that allow for data analysis
- Visual Basic for Applications(VBA)
- Process of the worksheet and flexible workbook
- Enables quick data validation
Spreadsheets remain crucial and are a fantastic resource for learning about data. Excel is not always the best or the only option for data projects, but it is still a reliable and affordable analytical tool. It is a vital framework for advanced analytics since it makes the analytical procedure easier to understand.
Many industries and organisations still emphasise the importance of Excel skills since it is still a wise technique to gather organisational insights. Excel can do it all, from making reports to performing basic computations. Excel proficiency is becoming a need in the modern world.
The top Excel Interview Questions and Answers for freshers and experienced are included in this article:
Basic Excel Interview Questions
1. What is the ribbon in excel?
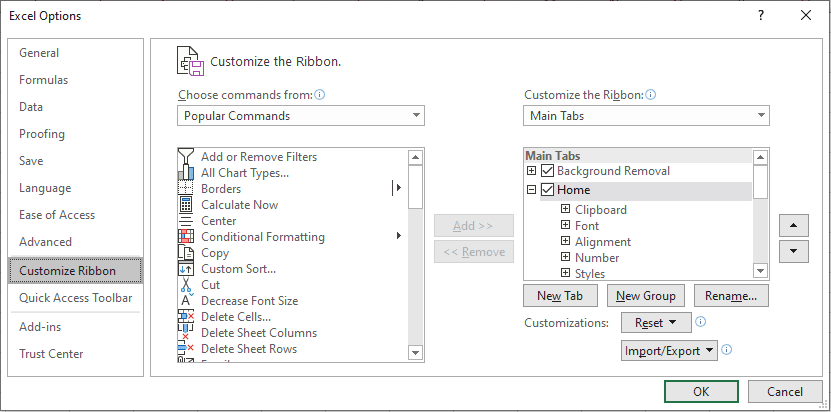
The term "ribbon" refers to the region at the top of the application that houses the MS Excel toolbars and menu items. With CTRL+F1, the ribbon can be displayed or hidden. The toolbars and menus have been replaced by the ribbon, which runs across the application's top. The top of the ribbons has a number of tabs, and each tab has its own set of commands. It has numerous tabs, including File, Home, View, Insert, and others. The ribbon can be altered to fit your requirements. Right-click on the Ribbon and choose "Customise the Ribbon" from the menu that appears. The following window appears as shown below. Each of these options is available for you to select or deselect.
Source: SpreadsheetWeb


 Real-Life Problems
 Prep for Target Roles
 Custom Plan Duration
2. What are wildcards in Excel?
Excel has three wildcards:
- Asterisk(*): It represents zero or more characters. Ex*, for instance, might stand for Excel, Extra, Expertise, etc.
- Question mark(?): It represents a single character. R?in, for instance, might be either Rain or Ruin.
- Tilde(~): A literal asterisk (*), a literal question mark (? ), or a literal tilde (~) can be created by adding a tilde (~) before a wildcard character to negate its effect.
3. Explain data validation in excel.
The types of values that a person may enter into a specific cell or a range of cells are limited by data validation. Choose the "Data Validation" option under "Data Tools" on the Data tab. Choose the data validation type you want to use. For example, a 'Name' column has data validation applied to it so that it will only take text entries. It will throw an error if you enter anything other than text.
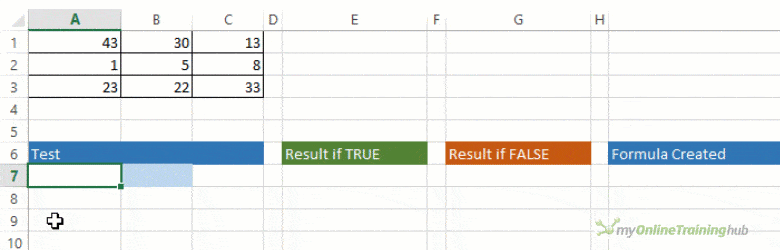
4. A student table is provided below. The following criteria should be used to write a function that adds pass/fail to the results column.The student will pass if their grade is greater than 60 and their attendance is higher than 75%.
To fill in the results column, use the IF() function and a check with an AND condition.

Source: Simplilearn
5. Explain the difference between SUBSTITUTE and REPLACE in excel.
- A string can have one or more instances of any old text substituted with fresh text using the SUBSTITUTE function.
Syntax:
SUBSTITUTE(text, prevText, newText, instanceNumber)Example:
Let text at A1 be happy77
SUBSTITUTE(A1,”7″,”8″,1) =>happy87
SUBSTITUTE(A1,”7″,”8″,2) =>happy88
- The REPLACE function changes any portion of the old text string with new text.
Syntax:
REPLACE(oldText, startNumber, NumberCharacters, newText)Example:
Let text at A1 be happy77
REPLACE(A1,6,1,”00″) =>happy007
 Learn via our Video Courses
6. Which two macro languages are there in Microsoft Excel?
VBA and XLM (Visual Basic Applications). XLM was utilized in Excel's past editions. VBA was first used in Excel 5 and is now primarily used.
7. What is a macro in excel?
Users can automate straightforward, repetitive chores and instructions using macros. For instance, rather than having to manually calculate sales, profits, losses, etc. every day, you could develop a macro that automatically calculates them at the end of the day and use it going ahead. Macros can be recorded and played at a later time or written down for use. Either go to the Developer tab and select Record Macro or go to the View tab to access it.

 Real-Life Problems
 Detailed reports
8. What is a pivot table?
One of Excel's most effective tools, a pivot table is always helpful when examining data. Excel pivot tables let you easily count, compare patterns, and confirm data trends while also analyzing large amounts of data.
A pivot table summarises your data. The information is presented as a chart. You can report on and investigate patterns using a pivot table and the data you've already given it. When working with large datasets, pivot tables are useful. To process data and information in our Excel spreadsheets, pivot tables are versatile and useful reports.
The following are some of the features of Excel pivot tables:
- Allow the precise facts you need to evaluate to be displayed
- Provide several vantage points to view the data
- Allow you to concentrate on crucial details
- Data comparison is quite useful.
- Pivot tables may recognize a variety of patterns, connections, data trends, etc.
- They can produce data instantly.
- Reliable reports
- Act as the foundation for pivot charts

Source: Excelcampus
9. How do you create a pivot table?
It's not as difficult as it first appears to make a pivot table. To get the most out of this process, it is necessary to be aware of all its specifics.
- Make the data ready
- Put your information in the excel sheet.
- To construct a pivot table, highlight your cells.
- In "Row Labels" or "Column Labels," drag and drop a field.
- Drag a field into the "Values" section.
- Adjust your calculations.

While creating a pivot table, keep these in mind:
- Each of the columns' first-row headings should be distinctive.
- There should only be one type of data in each column.
- Rows can only include information for a single recording.
- no empty rows
- Columns shouldn't be left entirely empty.

- The data needed to create the pivot table must be kept apart from the other data in the sheet.
Select the table, then click on the Insert tab to create a pivot table. Then choose the Pivot Table command, and the following window will appear:
Click OK after specifying the location where the table will be created. You will observe that a blank pivot table has been created once this is complete. Moreover, the PivotTables Fields window, which aids with pivot table configuration, will open.
10. Differentiate between Pivot charts and standard charts.
The following are a few differences between Pivot charts and standard charts:
- The row/column format: A Pivot Chart's row/column orientation cannot be changed using the Select Data Source dialog box, in contrast to a normal chart. Instead, you can achieve the same result by pivoting the Row and Column labels of the corresponding PivotTable.
- Chart type: A Pivot Chart can be changed into any form of a chart, with the exception of a xy (scatter), stock, or bubble chart.
- Source of data: Pivot Charts are based on the data source of the related Pivot Table, whereas standard charts are tied directly to worksheet cells. In contrast to a standard chart, the Pivot Chart's Choose Data Source dialog box does not allow you to alter the chart's data range.
- Formatting The majority of formatting, including newly added chart elements, structure, and style, is kept when you reload a Pivot Chart. Trendlines, data labels, error bars, and other modifications to data sets, however, are not kept. After being applied, standard charts retain their formatting. Although you can't directly modify the data labels in a Pivot Chart, you may still do it by increasing the text's font size.
11. How does a slicer work in Excel?
Excel uses slicers to easily filter Pivot Tables. Even more, you can link numerous slicers to numerous pivot tables.
Do the following to add a slicer to the pivot tables:
- Choose any cell in the pivot table by clicking it.
- Select Analyze, then Filter, then Insert Slicer.

12. What are the steps to split a column into two or more columns?
The following are the steps to split a column into two or more:
- Choose the cell you would like to split. Then, click on Text to Columns under the Data tab.
- Decide on a delimiter.
- Choose the location where you wish to display the split after selecting the column data format.
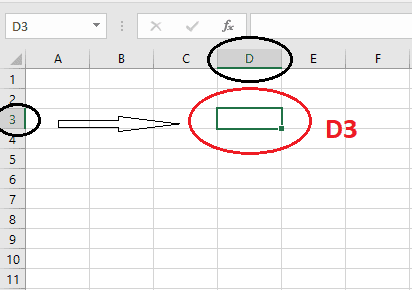
13. What is a cell address?
On a worksheet, a specific cell is identified by its cell address. It is determined by the appropriate column letter and the corresponding row number.
The highlighted cell's address is D3 because, as shown, it is in row 3 and column 'D'.
14. Differentiate between the terms "absolute cell referencing" and "relative cell referencing" in Microsoft Excel.
Instead of using values while generating a formula, we use cell references. In this method, as we alter the values of the cells, the formula's outcome also alters. References come in two varieties:
- Relative Reference: Relative references indicate the precise location of the cell, and it is the row and column in which the cell that has a value or a formula is situated. If we try taking that same cell to relocate it to another cell, worth the redundancy, it will refer to the new cells according to where they are located. As a result, we can claim that Excel predetermines relative references. Example: See the illustration below, where there is a formula written in C9 and copied to C10. As you can see, C10, as opposed to A9 and B9, displays the total of A10 and B10.

- Absolute Reference: An exact address is represented by the absolute reference. In other words, it constantly refers to the same cell, making it impossible to change them during copying. Absolute references are crucial since they are fixed, which is excellent when using Excel functions or formulae. Example: The $ symbol must come before the column and row numbers if you want to use absolute referencing. The row and column addresses do not change when absolute cell references are used; they stay the same. Look at the illustration in the following image:
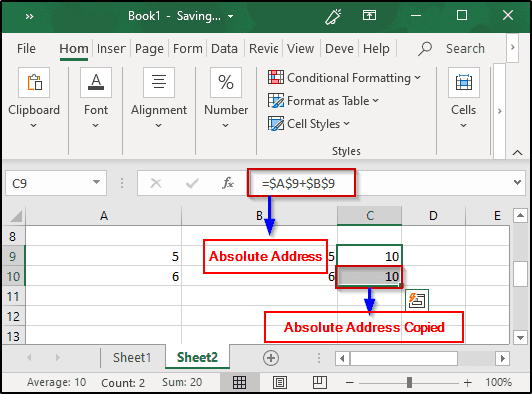
Image Source: Edureka
15. What do you understand by “freeze panes” in MS excel?
With freeze panes, any row or column can be locked. Even if we vertically or horizontally scroll the sheet, the locked row or column will still be visible on the screen. Observe the instructions below to freeze panes in Excel.
- Choose the Rows and Columns you want to Freeze first.
- Then choose Freeze Pane from the View tab.
- Now, you have the following three options to pick and choose which rows and columns to freeze.
16. How can one restrict copying a cell from a worksheet?
To restrict someone from copying a cell from our worksheet, we need to follow the steps given below:
- Select the data you wish to safeguard first.
- Press Ctrl, Shift, and F. It then shows the Format Cells tab. Select the Protection tab. Click OK after selecting Locked.
- Then, click Protect Sheet from the Review menu. To secure the sheet, enter the password.
Gif Source: WPS Academy
17. Differentiate a formula from a function in excel.
-
Formula:
- The user types in the formula, which looks like an Excel equation. Based on the user's preference, it might be any kind of calculation. It takes longer to manually type a formula each time you need to make a computation.
- Example: B1 + B2 + B3
-
Function:
- An Excel function is a built-in computation that has been predefined. Using functions makes conducting computations quicker and more comfortable.
- Example: SUM(B1 : B3)
18. Discuss how Excel evaluates formulas in terms of the order of operations.
PEDMAS is the term used to describe the Excel operation order. The precedence list for an Excel operation is displayed below.
- Parentheses
- Exponentiation
- Division/Multiplication
- Addition
- Subtraction
As can be seen above, the exponentiation process is performed after the data in the parenthesis is processed. Following that, either the division or multiplication procedures may be performed. The outcome is then added and finally subtracted, to provide the result.
19. Write the differences between COUNT, COUNTA and COUNTBLANK.
- COUNT: The number of cells with simply numerical values is counted. Blank cells, special characters, and cells with string values will not be included in the calculation.
- COUNTA: The number of cells with any kind of content is counted. Numeric data, special characters, and string values contained in cells will all be counted. A blank cell will not be taken into account, though.
- COUNTBLANK: It solely counts the number of blank cells, as the name would imply. Content-containing cells will not be taken into account.
20. How can we combine text strings from several cells into one cell?
Use the CONCATENATE command to combine text strings that are contained in numerous cells into one cell. Up to 30 text pieces can be joined using the Excel CONCATENATE function, which returns the result as text.
The Excel Concatenate function has the following syntax: CONCATENATE (text1, text2, ..)
The following formula can be used to CONCATENATE the values of two cells, A2 and B2: CONCATENATE (A2, B2). There will not be any delimiters used when combining the values. Use a space (" ") to demarcate the values: CONCATENATE(A3, " ", B3).
21. How would you add comments to your cells?
You must right-click a cell and select add comment from the cell menu to add a comment to it. Write your comment in the space provided for comments. There is a comment associated with that specific cell if there is a red triangle in the upper right corner of the cell. Right-click the cell and choose "Delete Comment" from the cell menu to get rid of a comment.
22. What are spreadsheets?
Spreadsheets are software programs that facilitate effective data organization, calculation, and sorting. A spreadsheet consists of rows and columns spread throughout. The total number of rows and columns on an MS excel worksheet is 1,048,576 rows by 16,384 columns.
There is a worksheet (labeled "Sheet1") as shown below, and we also notice a "+" sign somewhere at the bottom, which indicates we can create a new sheet. We can add, rename, remove, hide, show, and perform other actions on sheets. Worksheets are added by default as Sheet1, Sheet2, etc. Such sheets are simple to rename as necessary.

23. What is VLOOKUP in excel? How does the VLOOKUP function work?
Excel's VLOOKUP (which stands for Vertical Lookup) function is used to find and produce data from a specific set. To make use of this functionality, we need to arrange the data vertically because V is for Vertical in VLOOKUP. Whenever we need to find a certain amount of data from a vast amount of data, VLOOKUP is tremendously helpful.
The VLOOKUP function in Excel has a lookup value and starts searching in the left-hand column. VLOOKUP will move right, or into the search value row if the value of that search appears first. It keeps on until the specified column number is returned. This function compares estimated and true search values. Nonetheless, the default match is approximate.
Here,
- lookup_value: The value that you wish to check for is known as the lookup value.
- table_index: The set of data to be taken from is the table index.
- col_index_num: col index num specifies the column you wish to extract the value from.
- range_lookup: Logical value, i.e., TRUE or FALSE, is the range lookup (TRUE finds the closest match; FALSE will check for an exact match)
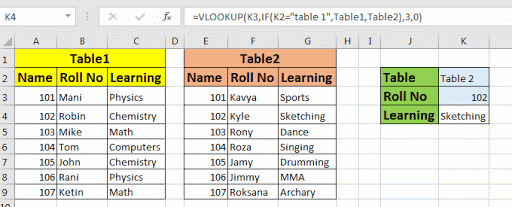
24. Can VLOOKUP be used on many tables?
Indeed, you can use VLOOKUP for several tables. If you have two search tables, create named fields for each of them and use the IF function to choose from each table in accordance with a predetermined set of criteria.
Source: Excel Tip
25. How is VLOOKUP different from LOOKUP?
The user can use VLOOKUP to search for a value in a table's leftmost column. The value is then returned in a left-to-right way. On the other hand, the user can search for data in a row or column using the LOOKUP function. It shows up the value in a different row or column.
26. Discuss the functionality of IF() in Excel.
The IF() function in Excel does a logical test. If the test results in true, it returns a value; if the test results in false, it returns a different value. Whether the condition holds for the full chosen range determines what value is returned.
Source: My Online Training Hub
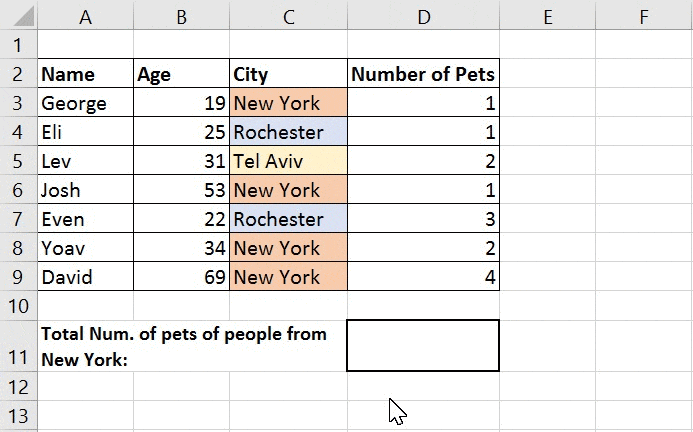
27. Discuss the functionality of SUMIF() in Excel.
Cell values described by a particular condition or set of criteria are added by the SUMIF() function.
Syntax: =SUMIF(range, criteria, [sum_range])
Source: Excel Practice Online
Note:
- range (necessary): the set of cells you want to subject to criterion. Each range must include only numbers, names, arrays, or references containing numbers. Values that are blank or text are ignored. Dates in the typical Excel format could be found in the selected range.
- criteria (necessary): A number, expression, cell reference, text, or function that specifies which cells will be added can all be used as criteria
- sum_range (optional): the actual cells to add if you wish to add cells that are not listed in the range argument. The cells that are given in the range parameter are added by Excel if the sum_range argument is not present (those cells to which the criteria are imposed).
28. How do you create a dropdown list in excel?
The 'Data Validation' option found in the Data tab can accomplish this.
- Select the cells in which the drop-down lists are to be added.
- Select Data, then click on Data Validation.
- Select List from the menu under Allow.
- Give the input for the items (separated by a comma) in your dropdown list in the Source tab.
The dropdown list is ready.

Source: Trump Excel
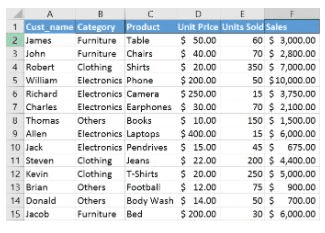
29. Highlight the cells with total sales > $5000 using the sales information below.
Cells that meet the criterion are highlighted in this case using conditional formatting. Choose "Conditional Formatting" from the home tab, then "Greater Than option" under the Highlight Cells Rules section. Choose the color for the highlighted cells and specify the criterion.
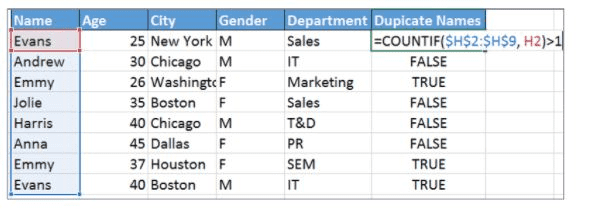
30. How do you identify repeated values in a column?
You may utilize conditional formatting or the COUNTIF() function to identify duplicate values in a column.
- Conditional Formatting: Choose "Highlight Cells Rules" under Conditional Formatting after first selecting the Home tab. Next, select "Duplicate Values."
- COUNTIF(): To determine whether the values in a given column are repeated, you can implement a COUNTIF() method.
31. How can duplicate values be eliminated from a cell range?
You may eliminate duplicate values by choosing the 'Remove Duplicates' option from the Data Tools menu on the Data tab.
32. What is the difference between VLOOKUP and HLOOKUP in Excel?
VLOOKUP and HLOOKUP both help you search for data in a table, but the direction is different. VLOOKUP searches vertically in the first (leftmost) column and returns a value from a column you specify, while HLOOKUP searches horizontally in the top row and returns a value from a row you choose. The syntax is similar:
=VLOOKUP(lookup_value, table_array, col_index_num, [range_lookup])and
=HLOOKUP(lookup_value, table_array, row_index_num, [range_lookup]). You use VLOOKUP when data is arranged in columns and HLOOKUP when it is arranged in rows. Both cannot look to the left (VLOOKUP) or above (HLOOKUP) the lookup area.
33. What is the difference between the FIND and SEARCH functions in Excel?
FIND and SEARCH are used to locate the position of text inside another text string. The main difference is that FIND is case-sensitive and does not allow wildcards, while SEARCH is case-insensitive and supports wildcards like * and ?. The syntax is
=FIND(find_text, within_text, [start_num])and
=SEARCH(find_text, within_text, [start_num]). If you need exact case matching, use FIND. If you want flexible matching without worrying about capital letters, use SEARCH.
34. What are named ranges in Excel? How do you create and use them?
Named ranges are labels given to a cell or group of cells so you don’t have to use references like
A2:A500. For example, instead of
=SUM(A2:A500), you can name it “SalesData” and write
=SUM(SalesData). You can create one using the Name Box near the formula bar or through Formulas → Define Name. Named ranges make formulas easier to read and help in quickly navigating large worksheets.
35. What is the IFERROR function in Excel? Why is it important?
IFERROR is used to handle errors in formulas in a simple way. Its syntax is
=IFERROR(value, value_if_error), meaning if the formula returns an error, Excel will show the value you choose instead. For example, when VLOOKUP shows #N/A, you can display “Not Found” instead. It works for all error types and is cleaner than using nested
IF(ISERROR())formulas. This makes reports look more clear and professional.
36. What is the TEXT function in Excel? Provide examples.
“Total Sales: ” & TEXT(A1, "$#,##0")
. This helps control how dates, numbers, and percentages appear in your final result.
=TEXT(1234.5, "$#,##0.00")
shows a formatted currency value. It is useful when combining numbers with text, like
=TEXT(TODAY(), "DD-MMM-YYYY")
shows a formatted date, and
The TEXT function converts numbers into text in a specific format using=TEXT(value, format_text)
. For example,
Advanced Excel Interview Questions
1. Can many tables be used to build pivot tables?
Absolutely, more than one basis table can be used to build pivot tables. Follow these instructions to do this:
- To launch the Pivot Table Wizard, press Alt+D followed by P.
- When you click Next after selecting the Multiple consolidation ranges option, another dialog box will appear.
- Choose the option "I will create the page fields" and then click "Next".
- The relevant ranges must all be added in the following window.
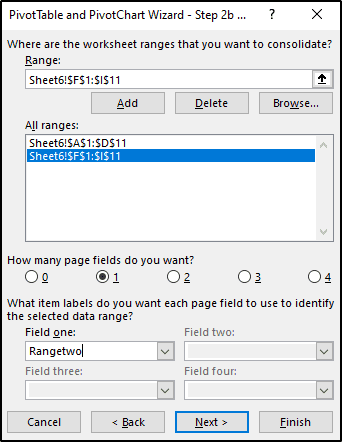
- Once that is finished, select the region where you wish to construct the table by clicking Next and then clicking Finish.
- You will observe that the pivot table was produced by combining the two tables.
2. Can you use tables from separate worksheets to create a pivot table?
You can also build a pivot table for tables from different sheets if both sheets are from the same worksheet. Use the same procedures as in Q31 to construct a pivot table from two separate sheets. After you define the tables, navigate to the appropriate sheet and choose the tables you want to combine.
3. Without installing Microsoft Office, how can I produce an Excel (.XLS and .XLSX) file in C#?
ExcelLibrary can be used to create Excel files in C# without the need to install Microsoft Office. It is an open-source, cost-free, and basic library on Google Code. It is a PHP ExcelWriter port. It includes a DataSetHelper that makes using DataSets and DataTables easier. ExcelLibrary supports the older Excel format (.xls files), and support for the more recent 2007/2010 formats will be added.
The alternative is EPPlus. It has NPOI and is compatible with Excel 2007/2010 format files (.xlsx files). Pivot Tables are also supported by EPPlus.
4. How can you prevent Excel from turning specific text values into dates automatically?
That is a common problem encountered by Excel users. But, you can include a '=' before the double quotes to prevent Excel from turning certain text values into dates automatically. The data must be text due to this operation. Example: =”2022-11-27″.
5. Is it possible to crack the password for an Excel VBA project?
Indeed, using a spreadsheet in the.xls format, we can decrypt the password for an Excel VBA project. Due to the secure nature of.xlsx files, this won't function with them. Using a hex editor, change the password entry in the file.
- Create a fresh .xls file.
- Set a simple password, such as "abcd," in the VBA section.
- Save the document, then exit
- Verify the file size.
- Use a hex editor to view the file.
- Start copying the lines with the ensuing keys: CMG=…., DPB=…, GC=…
- Now that we don't know the VBA password for the excel file, we need to back up that data.
- Using the hex editor, launch the file
- Put the lines you just copied from the dummy file in there.
- Save the excel document, then quit.
- Open the excel document where the VBA code has to be checked. The password is abcd.
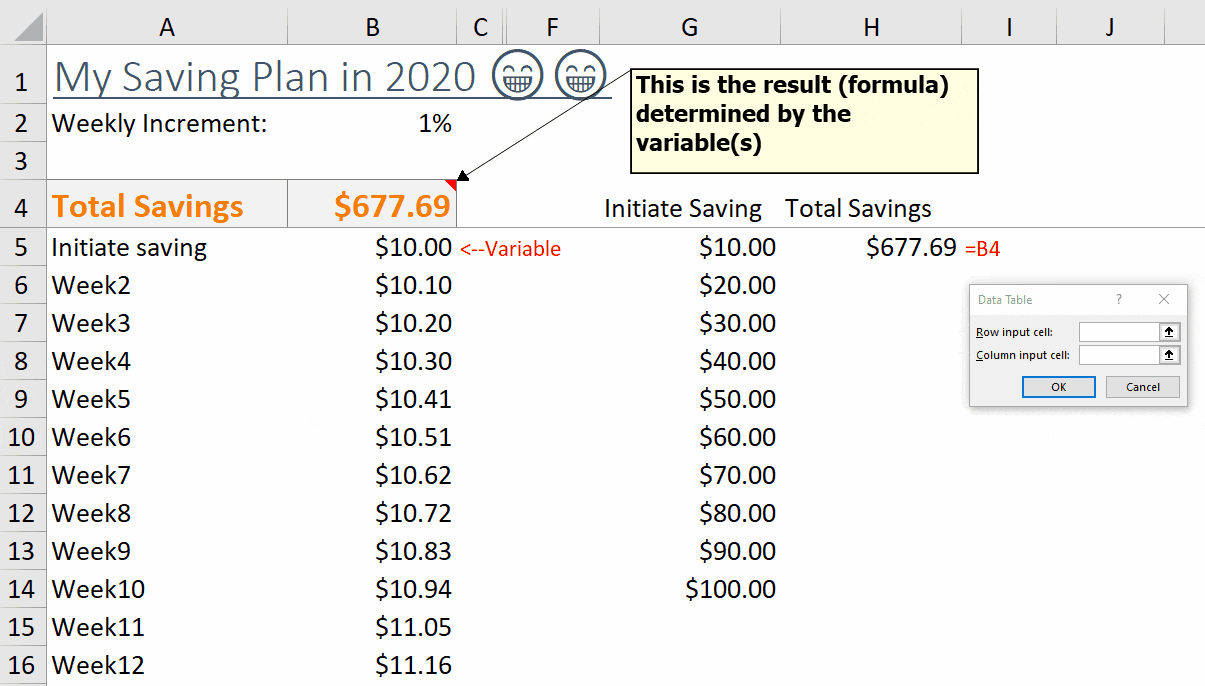
6. What do you understand by What If analysis?
What-if analysis is a technique for changing one or more cellular formulas to examine how the changes affect the worksheet results. Three different What-if approaches for analysis are available in Excel: Scenarios, Goal Seek, and Data Tables.
Data tables and scenarios offer a selection of inputs for potential results. While several variables can work with scenarios, a limit of 32 input values is allowed. Data tables only work with one or two variables, but they can all take on a variety of different values. Unlike Scenarios and Data Tables, Goal Seek takes outputs and determines prospective inputs to the same.
Source: Wmfexcel
7. How can I disable Pivot Tables' automatic sorting?
The data that is available in the Pivot Tables are automatically sorted by Excel. If you do not want Excel to do this action, select More Sort Options from the drop-down option for the Row Labels or Column Labels. The Sort dialog box appears as it opens. Deselect the option for Automatic Sort by selecting More Options.
8. What distinguishes a function from a subroutine in VBA?
| Function | Subroutine |
|---|---|
| A function's responsibility is to give the result of the task it performs. | Subroutines, on the other hand, don't return the result of the task they are carrying out. |
| A variable calls them. | They can be recalled in many ways and at any point in the program. |
| Functions are used in spreadsheets in the same way that formulas are. | Spreadsheets do not directly use subroutines as formulas. |
| Repetitive tasks are performed by functions, which then return a value. | Before retrieving the subroutine's output, users must enter a value in the targeted cell. |
9. How would you debug a VBA code?
The F8 key can be used to debug a VBA program line by line. Also, you have the option of setting a breakpoint to stop the execution anywhere.
When you press F8, the code will begin to be executed from the beginning and continue until the conclusion, executing the following line each time. The highlighted line and the yellow arrow indicate the current point of execution.
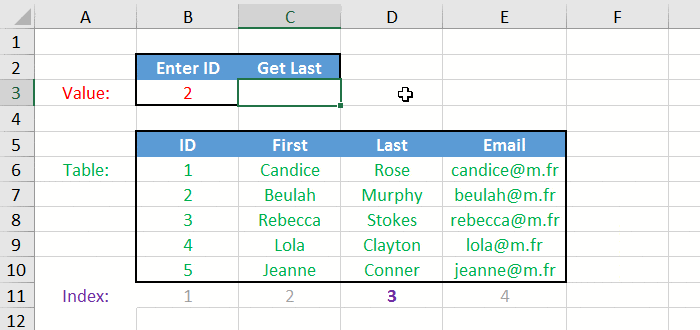
10. Provide an illustration of the approximate match.
When there are no exact matches for the provided lookup_value, VLOOKUP will fetch values to get an approximate match. Set the range_lookup value to TRUE for a rough match. Keep in mind that for VLOOKUP to do an approximate match, the table must be ordered in ascending order. In this case, VLOOKUP basically starts by searching for a roughly matching value to the specified lookup value before stopping at the value that is the next largest. It then enters that row to return the value from the designated column.
Example:
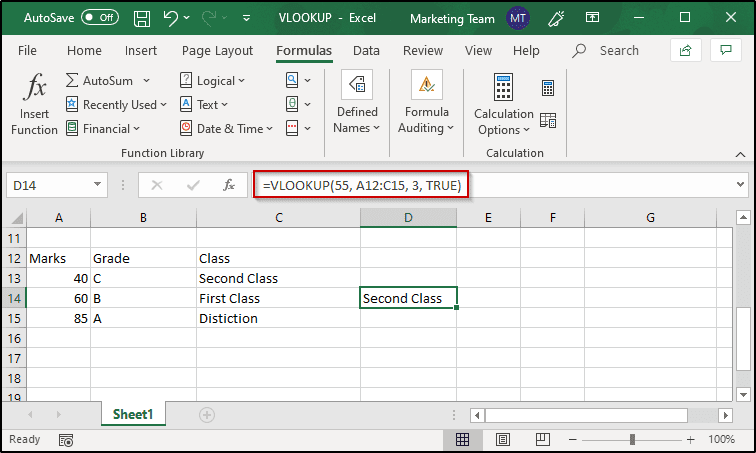
- Choose the target cell, then enter "=".
- Deploy VLOOKUP.
- Add the lookup value to the list of parameters.
- Use TRUE as the range lookup value.
- The function will be =VLOOKUP (55, A12: C15, 3, TRUE)
The lookup value is 55 and the next largest value near the lookup value that is present in the first column is 40. Hence, the output is ‘Second Class’.
11. What are circular references in Excel? How do you resolve them?
A circular reference happens when a formula refers back to its own cell, either directly or through other cells, creating an endless loop. Excel usually shows a warning and may return 0 or an incorrect value. You can find it from Formulas -> Error Checking -> Circular References and trace where the issue is coming from. The best fix is to rewrite the formula so it doesn’t refer to itself. Excel also allows iterative calculations (File -> Options -> Formulas), but this should only be used when it must serve a purpose, like in financial models, because it can give unstable results if not handled carefully.
12. What is the difference between .xls and .xlsx file formats?
.xls is the older Excel format (Excel 97-2003) and supports up to 65,536 rows and 256 columns. .xlsx is the newer format (Excel 2007+) and supports 1,048,576 rows and 16,384 columns, with smaller file size due to compression. .xlsx does not support macros, so for that you use .xlsm (macro-enabled). There is also .xlsb, a binary format that opens faster for large files. .csv is different because it only stores raw data without formatting or formulas.
13. What is the difference between ROUND, ROUNDUP, and ROUNDDOWN in Excel?
ROUND follows normal rounding rules, meaning it rounds up or down based on the number. ROUNDUP always rounds away from zero, and ROUNDDOWN always rounds toward zero. The syntax is similar, like
=ROUND(number, num_digits). For example,
=ROUND(2.345,2)gives 2.35,
=ROUNDUP(2.341,2)gives 2.35, and
=ROUNDDOWN(2.349,2)gives 2.34. MROUND rounds to the nearest multiple, while INT and TRUNC remove decimals differently. In billing or tax calculations, ROUNDUP is often used to avoid undercharging.
14. How do you protect a workbook vs protecting a worksheet in Excel? What is the difference?
Protecting a worksheet (Review → Protect Sheet) controls what users can do inside a specific sheet, like editing cells or deleting rows. Protecting a workbook (Review → Protect Workbook) prevents structural changes such as adding, deleting, or renaming sheets. So sheet protection is about content, while workbook protection is about structure. You can also allow specific users to edit certain ranges using “Allow Edit Ranges.” Password protection exists, but it should not be considered very strong security.
15. What are Excel Tables (structured references)? How are they different from normal ranges?
Excel Tables are created using Insert → Table or
Ctrl+Tand turn normal data into a structured format. Tables automatically add filter buttons, banded rows, and expand when new data is added. They use structured references like
=SUM(SalesTable[Revenue])instead of cell ranges like
C2:C500. Formulas in tables automatically fill down for new rows. Tables are easier to manage and work very smoothly with Pivot Tables and Power Query compared to normal ranges.
16. What is INDEX-MATCH in Excel? Why is it preferred over VLOOKUP?
INDEX-MATCH is a powerful lookup combination often asked in advanced excel interview questions and answers and index match interview questions. MATCH finds the position of a value, and INDEX returns the value from that position:
=INDEX(return_range, MATCH(lookup_value, lookup_range, 0)).
Unlike VLOOKUP, it can look left, and it doesn’t break if columns are inserted or deleted. It also works for both vertical and horizontal lookups and even two-way lookups. Use 0 for exact match, 1 or -1 for an approximate match, and wrap it with IFERROR to handle missing values.
17. What is XLOOKUP in Excel? How does it improve upon VLOOKUP and INDEX-MATCH?
XLOOKUP is a modern replacement for older lookup functions and is common in excel interview questions for data analyst roles. Its syntax is
=XLOOKUP(lookup_value, lookup_array, return_array, [if_not_found], [match_mode], [search_mode]). It can search left, right, up, or down without any extra formula. It also has built-in error handling and uses exact match by default. Match modes include exact (0), approximate (-1, 1), and wildcard (2), and search mode even allows reverse or binary search.
18. What are dynamic arrays in Excel? Explain FILTER, SORT, UNIQUE, and SEQUENCE functions.
Dynamic arrays Excel features are heavily covered in advanced excel interview questions. These formulas return multiple results that automatically spill into nearby cells. FILTER extracts data based on conditions, SORT arranges data, UNIQUE returns distinct values, and SEQUENCE generates number series. The spill range can be referred to using the
#symbol. These functions replace many old Ctrl+Shift+Enter formulas and make data analysis much faster.
19. What are array formulas in Excel? What is the difference between CSE arrays and dynamic arrays?
Array formulas calculate multiple values at once and are common in advance excel interview questions. Older CSE arrays required pressing
Ctrl+Shift+Enterand were shown inside curly braces {}. Dynamic arrays in Excel 365 spill results automatically without special keys. Earlier, formulas like
{=SUM(IF(A1:A10>5,B1:B10))}were used before SUMIFS existed. SUMPRODUCT was also a popular alternative that didn’t require CSE.
20. What is Power Query (Get & Transform) in Excel? Explain its use cases.
Power Query is an ETL tool built into Excel and is frequently asked in power query interview questions. It allows you to extract data from files, databases, web sources, and folders, then clean and transform it easily. You can merge tables, remove duplicates, change data types, and reshape data without writing complex formulas. The steps are saved and can be refreshed anytime, which makes it perfect for recurring reports. It uses M language in the background and is much more reliable than manual data cleaning.
21. What is Power Pivot in Excel? How is it different from regular Pivot Tables?
Power Pivot is an advanced data modeling tool used in excel data modeling interview questions. It can handle millions of rows and create relationships between multiple tables inside the Data Model. Unlike regular Pivot Tables, it uses DAX formulas and supports KPIs. It works well for complex analysis where multiple tables are involved. Many professionals use Power Pivot before moving to Power BI.
22. What is DAX in Excel? Explain common DAX functions used in Power Pivot.
DAX (Data Analysis Expressions) is a formula language used in Power Pivot and is common in dax interview questions. Functions like CALCULATE change filter context, SUMX and AVERAGEX perform row-by-row calculations, and RELATED pulls data from related tables. Time intelligence functions like TOTALYTD and SAMEPERIODLASTYEAR are used in financial reports. Understanding row context and filter context is important for analyst roles.
23. What is the LET function in Excel? How does it improve formula readability?
LET is a newer Excel function that improves complex formulas and appears in advanced excel interview questions and answers. It allows you to assign names to parts of a formula using
=LET(name, value, calculation). This avoids repeating the same calculation multiple times and improves performance. It also makes formulas easier to read and debug. LET can also be combined with LAMBDA for even more powerful solutions.
24. What is the LAMBDA function in Excel? How do you create custom functions without VBA?
LAMBDA allows you to create custom reusable functions without VBA and is becoming common in modern Excel interviews. You define it like
=LAMBDA(parameter, calculation)and store it in Name Manager. After that, you can use it like a normal Excel function. It even supports recursion and helper functions like MAP and REDUCE. This avoids macro security issues and keeps workbooks cleaner.
25. What is the INDIRECT function in Excel? What are its practical applications?
INDIRECT converts text into a real cell reference using
=INDIRECT(ref_text). It is useful for dynamic sheet references, like pulling data from a sheet name written in another cell. It helps in creating flexible reports and dynamic ranges. However, it is a volatile function, meaning it recalculates every time anything changes. It can also break if sheet names are changed.
26. What is the OFFSET function in Excel? How is it different from INDEX?
OFFSET returns a reference based on a starting point, using
=OFFSET(reference, rows, cols, [height], [width]). It is often used to create dynamic ranges for charts and dashboards. However, OFFSET is volatile and can slow down large files. INDEX can also return values or references but is non-volatile and more stable. For performance reasons, INDEX is generally preferred in large datasets.
27. What are Sparklines in Excel? What types are available?
Sparklines are small in-cell charts that show trends quickly and are useful in dashboards. There are three types: Line, Column, and Win/Loss. They are inserted from the Insert tab and help visualize data without creating full charts. You can customize colors, markers, and axis settings. They are commonly used in financial summaries and management reports.
28. How do you perform a two-way lookup in Excel? Explain INDEX-MATCH-MATCH.
A two-way lookup finds a value at the intersection of a row and column. The formula is
=INDEX(data_range, MATCH(row_value, row_range, 0), MATCH(column_value, column_range, 0)). This method is common in index match interview questions. It works well for matrix-style data like product vs month sales. In Excel 365, nested XLOOKUP can also achieve the same result more simply.
29. What are Excel Data Model and relationships? How do you create a relationship between tables?
The Data Model allows multiple tables to be connected inside Excel and is important in excel data modeling interview questions. You create relationships using a common key column through the Data or Power Pivot tab. It supports one-to-many relationships like a star schema. Once connected, Pivot Tables can pull fields from different tables without VLOOKUP. This is essential for serious data analyst work.
30. What is the difference between SUMIFS and SUMPRODUCT? When to use which?
SUMIFS adds values based on multiple conditions and is simple and fast for normal reporting. SUMPRODUCT multiplies arrays and then sums them, allowing more flexible logic like OR conditions or weighted calculations. For example:
=SUMPRODUCT((A1:A10="East")*(B1:B10>100)*C1:C10). SUMPRODUCT works well in advanced conditional calculations without helper columns. SUMIFS is preferred for straightforward multi-condition sums in most business reports.
EXCEL MCQ Questions
Which function is employed to trap and handle errors in excel?
How can you fetch the current date in excel?
How can you tell if the Pivot table in excel has been altered or not?
Is there a keyboard shortcut in Microsoft Excel to add a new sheet to the present workbook?
Is there a keyboard shortcut in MS Excel to view formulae rather than values?
The shortcut combination of keys CTRL + D in excel is used to __.
To calculate compound interest in Excel, you can use the __ function.
What filter should we employ if we want to analyse the list using a database function or if there are more than two conditions?
What is the maximum number of users who can open any Excel file at the same time?
What keyboard shortcut applies “Wrap Text” to the chosen text?
Which function in Microsoft Excel is used to eliminate excess spaces from the text?
Which logical function yields FALSE if all inputs are evaluated as FALSE and TRUE if any arguments are evaluated as TRUE?
Which MS Excel function serves to locate text within a string?
Which symbol in the formula in excel specifies the fixed columns or rows?
With which function in excel can many values be matched, and the first match is returned?