Measures of variability define how spread out the data is, basically how far the data points lie from the center of the distribution of the data. These measures usually comprise:
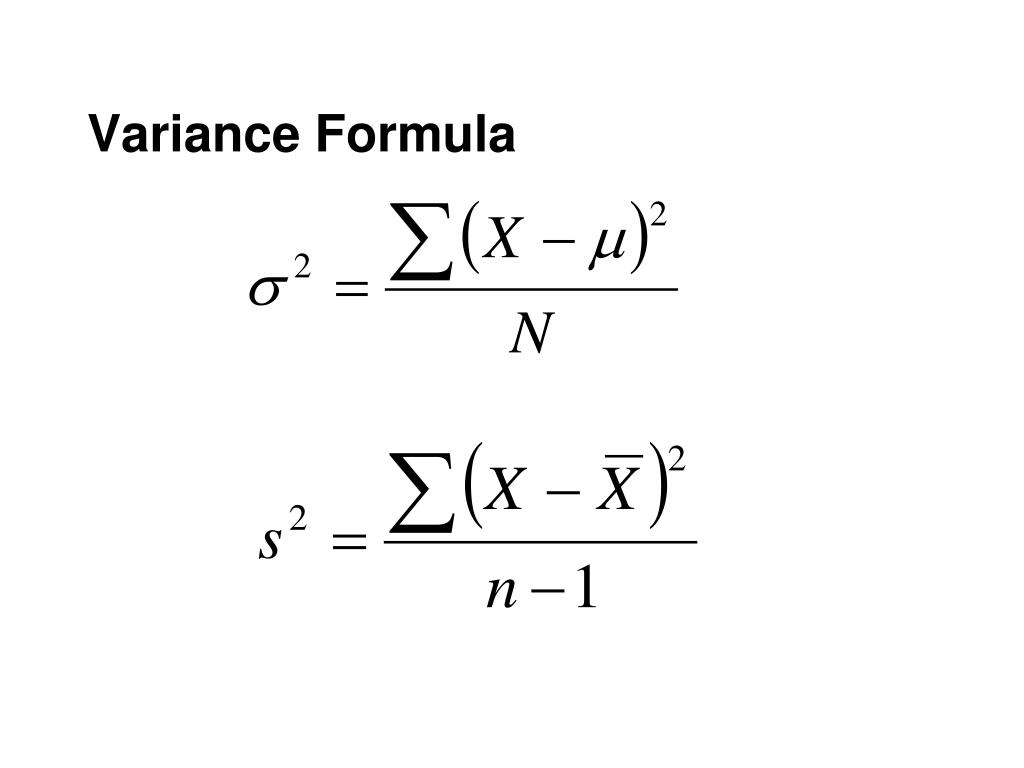
Variance: Measures the degree of spread within the distribution. Mathematically speaking, variance is the average of squared distances from the mean.

Where:
s^2 represents the sample variance and 𝛔^2 represents the variance of the population.
Standard Deviation: This measures the dispersion of the data with respect to the mean, basically the average distance from the mean. Mathematically this is calculated as the square root of variance.
Mean deviation: Similar to standard deviation, it measures the average deviation from the mean of the dataset. The only difference lies in the mathematical formulation of both. Mean deviation is calculated by taking the absolute difference between the data point and the mean, while standard deviation works on just the difference. Usually, the standard deviation is more preferred
Range: Basically, the difference between the highest and lowest number in a data.
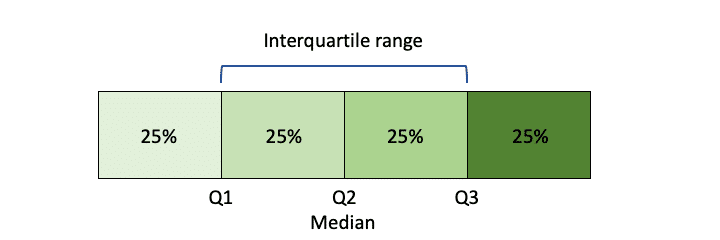
Interquartile range: This measures the difference between the 75th and 25th percentile range of the data. Percentile here basically indicates the value below which a certain percentage of the observations in a group of data samples fall.


 Video Courses


