Central Limit Theorem
The Central Limit Theorem (CLT) states that if you repeatedly sample a random variable a large number of times, the distribution of the sample mean will approach a normal distribution regardless of the initial distribution of the random variable.
The normal distribution takes on the form:
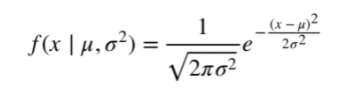
with the mean and standard deviation given by μ and σ, respectively.
The mathematical definition of the CLT is as follow: for any given random variable X, as approaches infinity,

The CLT provides the basis for much of hypothesis testing, which we will discuss shortly. At a fundamental level, you can consider the implication of this theorem on coin flipping: the probability of getting some number of heads flipped over a large n should be approximately that of a normal distribution. Whenever you are asked to reason about any particular distribution over a large sample size, you should remember to think of the CLT, regardless of whether it is Binomial, Poisson, or any other distribution.
Uber Interview Question:
Q. Explain the Central Limit Theorem. Why is it useful?
Ans: The CLT states that if any random variable, regardless of distribution, is sampled a large enough number of times, the sample mean will approximately be normally distributed. This allows for studying the properties for any statistical distribution as long as there is a large enough sample size.
Like Uber, any company with a lot of data, this concept is core to the various experimentation platforms used in the product. For a real-world example, consider testing whether adding a new feature increases rides booked in the Uber platform, where each X is an individual ride and is a Bernoulli random variable (i.e., the rider books or does not book a ride). Then, if the sample size is sufficiently large, we can assess the statistical properties of the total number of bookings and the booking rate (rides booked/ rides opened on the app). These statistical properties play a crucial role in hypothesis testing, allowing companies like Uber to decide whether or not to add new features in a data-driven manner.

 Video Courses